Lead Time vs Production Time vs Throughput Time vs Cycle Time, Every Manufacturing Metric Explained
Direct Answer:Production time is the time to manufacture a product once all materials are ready at the factory, factory floor only, from production start to finished goods. Lead time is the total customer-facing elapsed time from order placement to delivery, encompassing material procurement, production, quality inspection, packaging, and shipping. Throughput time is the total time a product spends inside the production system itself, including processing, queue waits, setup, and in-process inspection, but excluding procurement and shipping. Lead time is always the largest of the three; production time and throughput time are both subsets of it. For manufacturers and distributors expanding into global markets, understanding and accurately communicating all three metrics is essential for building reliable international trade partnerships. GTsetu connects manufacturers with verified partners across 100+ countries who publish transparent lead time capabilities.
📅 March 7, 2026⏱ 22 min read✍️ GTsetu Editorial Team🔄 Updated regularly
7
Time Metrics Decoded
100+
Countries on GTsetu
500+
Verified Partners
0%
Broker Commission
In B2B manufacturing, few misunderstandings cost as much as confusing lead time with production time. A buyer expecting delivery in 30 days because a manufacturer quoted a “4-week lead time”, when that figure actually only reflected production time, excluding 3 weeks of material procurement and 3 weeks of international shipping, will receive goods 10 weeks later. The result: broken distributor relationships, emergency airfreight charges, and lost contracts.
This guide decodes all seven key manufacturing time metrics, Lead Time, Production Time, Throughput Time, Cycle Time (Target and Actual), Takt Time, Material Lead Time, and Cumulative Lead Time, with formulas, real-world analogies, comparison tables, and a practical framework for reducing lead time in global B2B supply chains.
Before detailed breakdowns, here is a quick-reference overview. Each metric serves a different measurement purpose, confusing them leads to costly operational and commercial errors.
Lead Time
Customer Lead Time / Total LT
Total elapsed time from order placed to customer delivery. The master external-facing metric.
🎯 Customer-Facing
Production Time
Manufacturing Lead Time
Time to manufacture once materials are on-hand. A subset of lead time, factory floor only.
🏭 Factory Floor
Throughput Time
Flow Time / Mfg Throughput Time
Total time an item spends inside the production system, processing + queue + setup + inspection.
🔀 Whole Process
Cycle Time
Process Cycle Time (Target / Actual)
Time to complete one production cycle or one work step. Divided into target (planned) and actual (reality).
🔄 One Step
Takt Time
Production Rhythm / Demand Target
Maximum time allowed per unit to meet demand. Market-set target, cycle time must not exceed it.
🎵 Market Rhythm
Material LT
Procurement Lead Time
PO placed → materials received at factory. Driven by supplier geography and reliability.
📦 Procurement
Cumulative LT
Cumulative Lead Time
From-scratch manufacturing time = Material LT + Production Time. Drives safety stock planning.
📊 Planning
📐 How the Metrics Nest Within Each Other, Visual Timeline
Total Lead Time
← Order placed to delivery →
100%
Material Lead Time
Procurement
~28%
Throughput Time
Throughput (full process)
~42%
Production Time
Active manufacturing
~32%
QC + Packaging
QC
~10%
Shipping Time
Logistics & Delivery
~28%
Material Lead Time
Throughput Time (queue + process)
Production Time (active manufacturing)
QC + Packaging
Shipping Time
⚠️ The Most Expensive Mistake in B2B Manufacturing
When a manufacturer quotes “lead time” to an international buyer, they most commonly quote only production time, omitting material procurement, throughput queue time, and international shipping. A buyer planning inventory based on a quoted “4-week lead time” that actually covers only production will experience 8–12 week actual delivery times. This single misalignment is one of the most common causes of distributor relationship failure in the first 6 months. Always specify which components are included in any quoted lead time figure.
SECTION 2
2 The Restaurant Analogy, Quick Intuition for All Metrics
The fastest way to internalise the difference between lead time, production time, throughput time, and cycle time is through a familiar real-world scenario: ordering a steak at a restaurant.
🥩 Real-World Analogy, Ordering a Steak
📋
Lead Time
From when you order until the dish is on your table. Waiter enters order (2 min) + chef cooks (12 min) + waiter serves (2 min) = 16 minutes total. This is what you, the customer, experience.
🍖
Throughput Time
Total time the steak spends in the kitchen system: defrost (12 hrs) + season (5 min) + cook (6 min) + garnish (1 min) = 12.2 hours. Covers the full production process including prep/wait time.
🔥
Production Time
Active cooking time, seasoning + grilling + garnishing = 12 minutes. Excludes the 12-hour defrost queue time. This is what the chef is actively working on.
⏱
Cycle Time
How long the grill station takes to cook one side of the steak = 3 minutes per side. One work step, one unit. The cycle time of a single workstation in the production process.
🎵
Takt Time
If the restaurant receives 20 steak orders per hour and has 60 min of cooking capacity → Takt Time = 60/20 = 3 min per steak. The rhythm the kitchen must sustain to satisfy all customers.
🛒
Material Lead Time
How long it took the restaurant to receive the steak after ordering from the butcher. If the butcher delivers weekly, material lead time = up to 7 days, invisible to the customer but real for the kitchen.
SECTION 3
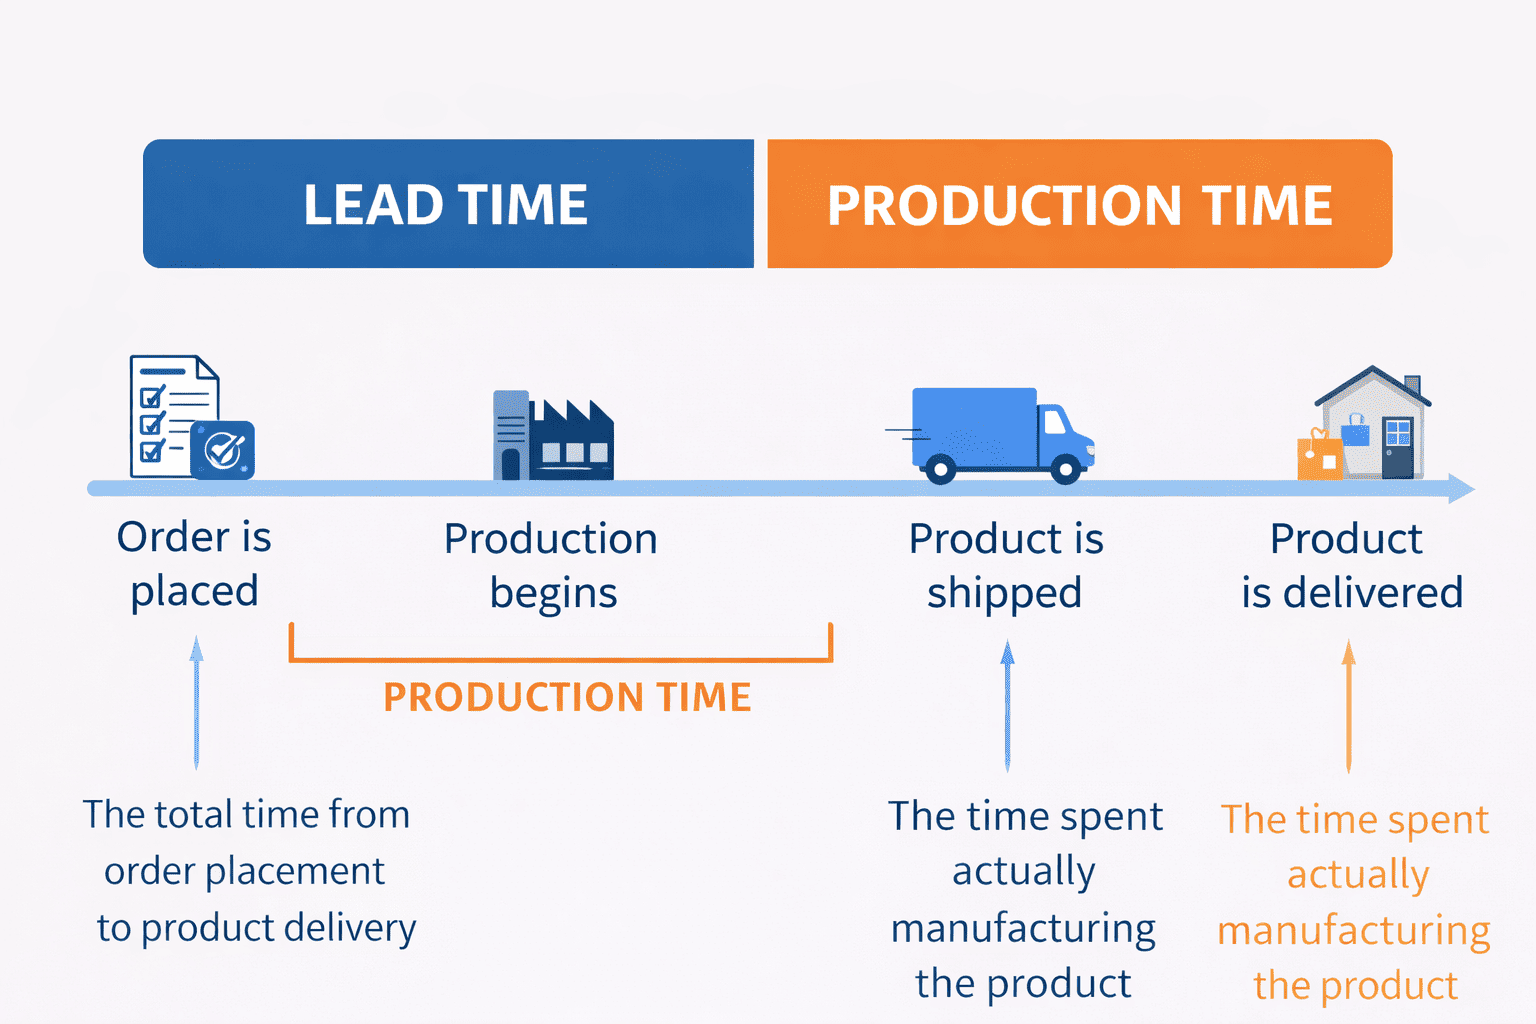
3 What Is Lead Time? (Full Definition)
🎯 Definition
Lead time is the total elapsed time between when a customer places an order and when the finished product is delivered. It is the primary customer-facing fulfilment metric, encompassing every phase from order confirmation through material procurement, manufacturing, quality inspection, packaging, export documentation, shipping, customs clearance, and last-mile delivery. In international B2B manufacturing, lead time is the single most critical performance indicator for winning and retaining distributors. Shorter, more predictable lead times drive higher buyer satisfaction, lower required inventory buffers, and stronger repeat business.
Lead Time Formulas
📐 Customer Lead Time
Customer Lead Time=Delivery Date−Order Date
Lead Time=Material LT+Production Time+QC & Pack+Shipping Time
Example: Material LT (7 days) + Production (14 days) + QC/Pack (3 days) + Sea Freight (25 days) = 49-day total customer lead time
Six Types of Lead Time in B2B Manufacturing
01
Customer Lead Time
The end-to-end metric the customer experiences from order placement to receipt. The sum of all other lead time types. This is the number buyers use to plan their inventory reorder points.
📍 “Our lead time to your EU warehouse is 7 weeks”
02
Material Lead Time
Time from placing a purchase order for raw materials or components to receiving them ready for production. Entirely supplier-dependent, the most variable and often longest component of total lead time in global supply chains.
📍 Ordering semiconductor components: 4–8 week supplier lead time
03
Production Lead Time
The manufacturing time once all materials are available. Synonymous with Production Time. Includes setup, active processing, queue time between operations, and in-process inspection.
📍 Apparel factory: 10 working days from cutting to finished garment
04
Shipping Lead Time
Transit time from factory gate to buyer’s location. For international trade: export docs + freight (sea/air/road) + customs clearance + last-mile. Sea freight from South Asia to Europe: 25–35 days.
📍 India to Germany sea freight: 28 days average
05
Cumulative Lead Time
Total time to manufacture from scratch with zero inventory, Material LT + Production Time. The minimum advance planning window. Critical for safety stock calculations and MRP input.
📍 Material LT (21 days) + Production (14 days) = 35-day CLT
06
Administrative Lead Time
Pre-production time: order review, credit approval, design sign-off, production scheduling, and purchase order placement. Often invisible but adds 1–5 days. Significant for custom or co-development orders.
📍 Custom order requiring 3-day design approval before production
23–35%
of total supply chain costs are inventory costs driven by long lead times
2–3×
shorter lead times vs competitors is a common differentiator for winning international distribution contracts
Material LT
is typically the biggest and most variable component, supplier selection is lever #1
Predictability
matters as much as speed, a consistent 8-week LT beats an unpredictable 4–12 week range
SECTION 4
4 What Is Production Time?
🎯 Definition
Production time (also called manufacturing lead time or production lead time) is the time required to manufacture a product once all necessary materials and components are already available at the factory. It starts when the production order is released to the floor and ends when the finished product passes quality inspection and is ready for outbound shipment. Production time is a factory-internal metric, it reflects the efficiency of the manufacturing process itself, independent of supply chain or logistics factors.
📐 Production Time Formula
Production Time=Production End Date/Time−Production Start Date/Time
Includes: setup time, active processing time, queue/wait time between operations, and in-process QC. Excludes: material procurement time, outbound shipping time, and administrative lead time.
What Production Time Includes
⚙️
Setup & Changeover
Time to prepare machines, tooling, and workstations before a new batch begins. Significant in high-mix, low-volume manufacturing, SMED (Single-Minute Exchange of Die) targets this directly.
🔧
Active Processing / Run Time
The actual manufacturing time, time a product spends being actively worked on at each production stage. This is the irreducible minimum; all other components are waste to be eliminated.
⏳
Queue / Wait Time
Time a WIP unit spends waiting between production steps. Often the largest single hidden component, lean manufacturing methodologies specifically target queue time reduction.
🔬
In-Process QC Inspection
Inspection at intermediate stages to catch defects early. Adds time in the short term but prevents expensive late-stage rework and batch rejection that would inflate total production time.
🔄
Rework & Correction
Time correcting defects found during production. High defect rates inflate production time significantly, often revealing process or material quality issues requiring root cause investigation.
📦
Finishing & Packaging
Final treatments, functional testing, labelling, packaging, and palletising. Often included within “production time” in practice, even though it technically sits between production and shipping.
SECTION 5
5 What Is Throughput Time?
🎯 Definition
Throughput time (also called manufacturing throughput time, flow time, or sometimes confused with production time) is the total time an item spends inside the production system, from when raw materials enter the factory to when the finished product exits ready for shipment. Unlike production time (which focuses on active manufacturing steps), throughput time includes all time spent in the system: active processing at each workstation, queue and wait time between operations, setup and changeover time, and in-process inspection. It is the complete “factory clock” for one unit’s journey through the entire production flow. Reducing throughput time is the primary goal of lean manufacturing.
📐 Throughput Time Formula
Throughput Time=Setup Time+Processing Time+Queue Time+Inspection Time
The steak analogy: Defrost (12 hrs) + Season (5 min) + Cook (6 min) + Garnish (1 min) = 12.2 hours total throughput time. Only 12 minutes was “active production time”, the defrost is queue/wait time, but it is still part of throughput time.
The Four Components of Throughput Time
Component
What It Is
Value-Adding?
Lean Manufacturing Treatment
Example
Processing Time
Active manufacturing, the item is being worked on
✅ Yes, only value-adding time
Optimise and protect
6 min grill time on the steak
Setup Time
Changeover, preparing machines for a new product/batch
⚡ Necessary but non-value-adding
Reduce via SMED methodology
30 min machine changeover between product runs
Queue / Wait Time
Item waiting between production steps for next operation
🔴 Waste, pure non-value-adding time
Eliminate via lean flow, pull systems
12-hour steak defrost; WIP waiting for CNC machine
Inspection Time
QC checks at intermediate production stages
⚡ Necessary NVA (prevents larger waste)
Reduce via poka-yoke and inline sensors
Dimensional check between machining operations
💡 The Throughput Time Insight for B2B Partners
When evaluating contract manufacturers or toll manufacturing partners, ask for throughput time (not just quoted production time). A CM who quotes “7-day production time” but has 3 days of queue time before your order starts and 2 days of inspection time after has an actual throughput time of 12 days, a 70% discrepancy from the quote. GTsetu’s verified partner profiles support transparency in these operational metrics.
SECTION 6
6 Lead Time vs Production Time, The Key Differences
This is the most commercially important distinction. Quoting production time when a buyer asks for lead time creates serious expectation mismatches that damage distributor relationships within weeks of the first shipment.
Dimension
Lead Time
Production Time
Definition
Total time from order placed to goods delivered to buyer
Time to manufacture once materials are available
Perspective
External, what the customer experiences
Internal, what the factory measures
Includes material procurement?
✅ Yes
❌ No, assumes materials on-hand
Includes shipping?
✅ Yes
❌ No
Includes customs clearance?
✅ Yes (international)
❌ No
Includes queue/wait time?
✅ Yes (within throughput time)
✅ Yes (within production)
Who measures it?
Sales, supply chain planners, distributors
Production managers, operations teams
Relationship
Lead Time ≥ Production Time (always)
Production Time ⊂ Lead Time (subset)
Typical scale (international B2B)
4–16 weeks
1–6 weeks
Apparel example
Fabric (21d) + Production (10d) + QC (3d) + Sea freight (30d) = 64 days
10 working days, cut to finished garment
✨ GTsetu Insight for International Manufacturers
When listing your capabilities on GTsetu or communicating with potential international distributors, always quote total lead time to buyer location, not just production time. Distributors in the EU, Americas, or Southeast Asia build their reorder schedules around total lead time, not factory production time. Misquoting is one of the top three reasons first-year distributor partnerships fail. Read more about structuring distribution agreements →
SECTION 7
7 Throughput Time vs Cycle Time
Both throughput time and cycle time are internal production metrics, but they measure at different scales. This is the distinction that matters most for production engineers and lean manufacturing teams.
Dimension
Throughput Time
Cycle Time
Scope
The entire production process, one unit’s journey from raw material to finished goods
One production cycle or one work step at a single workstation
Net Production Time ÷ Units Produced (at one station or for one cycle)
Relationship
Throughput Time = Sum of all cycle times + all wait/queue times
Cycle Time is one component of Throughput Time
Primary use
Measuring total factory efficiency for one unit; identifying improvement opportunities
Identifying bottleneck workstations; comparing to takt time
Steak analogy
12.2 hours (full kitchen journey from defrost to garnish)
3 minutes per side on the grill (one workstation, one operation)
Reduces when you…
Eliminate queue time, reduce setup, improve flow
Optimise one workstation, add capacity, reduce defects
SECTION 8
8 What Is Cycle Time? (Target vs Actual)
🎯 Definition
Cycle time is the actual time required to complete one production cycle, producing one unit (or one batch) from start to finish at a specific workstation or across the full production line. It is measured from when production of one unit begins to when the next identical unit begins. Cycle time is an internal operational metric that reveals how fast your factory is currently running. In production planning, cycle time is divided into two versions: target cycle time (the planned, ideal time based on engineering standards) and actual cycle time (what really happened). The gap between them is a key diagnostic tool.
📐 Cycle Time Formula
Cycle Time=Net Production Time÷Units Produced
Example: 360 minutes of production time → 40 units produced → Cycle Time = 9 minutes per unit. If takt time is 6 min/unit, production cannot meet demand.
Target Cycle Time vs Actual Cycle Time
⚖️ The Target/Actual Comparison, The Most Actionable Production Diagnostic
Target Cycle Time
Standard / Planned Time
The time a worker or machine should take to complete a specific production step, based on engineering standards, historical averages, or industrial engineering studies. The manufacturer’s production goal for every unit that passes through that work step.
Also called: Standard cycle time, nominal cycle time, planned cycle time
Actual Cycle Time
Real / Measured Time
How long the step actually took in practice, the true, measured time for a specific production run or shift. Actual cycle time is the practical counterpart of the theoretical target and captures real-world variability, machine performance, and operator skill.
Also called: Real cycle time, actual process time, observed cycle time
Comparing target vs actual cycle time, the target/actual comparison, is how manufacturers identify where production deviates from plan, spot bottlenecks, and prioritise improvement. A consistent gap where actual > target reveals either unrealistic targets or a process problem needing investigation. Closing this gap directly reduces throughput time and lead time.
Cycle Time vs Takt Time, The Decision Matrix
✅ Cycle Time < Takt Time
✅ Production keeps up with or exceeds demand
✅ No production-driven lead time extensions
✅ Capacity available to absorb more orders
✅ Buffer time for quality issues without delay
⚡ Cycle Time > Takt Time
⚡ Production cannot meet demand, backlog growing
⚡ Lead times extending as orders queue up
⚡ Overtime, additional shifts, or capacity investment required
⚡ Risk of delivery failures and distributor dissatisfaction
SECTION 9
9 What Is Takt Time?
🎯 Definition
Takt time is the maximum allowable time to produce one unit in order to meet customer demand, the production rhythm dictated by the market. The word “takt” comes from German for “beat” or “pulse”, first used in the German aircraft industry in the 1930s, later adopted by Toyota as a cornerstone of lean manufacturing. Takt time is not what you are currently producing (that is cycle time), it is what you need to produce to satisfy demand. It is the target; cycle time is the reality. When takt time falls below actual cycle time, lead times inflate.
📐 Takt Time Formula
Takt Time=Net Production Time÷Customer Demand (units/period)
Net Production Time = Total shift time − non-production time (breaks, maintenance, meetings). Example: 480 min shift − 120 min downtime = 360 min NPT. If demand = 60 units/day → Takt Time = 360 ÷ 60 = 6 minutes/unit.
Takt Time Scenarios, Three Production States
Scenario
Net Production Time
Daily Demand
Takt Time
If Actual Cycle Time = 9 min
Lead Time Impact
Action
Low demand
360 min
30 units
12 min/unit
CT (9) < TT (12) ✅
Meets commitments with buffer
Pace down or take new orders
Balanced demand
360 min
40 units
9 min/unit
CT (9) = TT (9) ⚡
No buffer, any disruption creates delay
Monitor closely, minimise downtime
High demand
360 min
60 units
6 min/unit
CT (9) > TT (6) 🔴
Backlog builds, lead time extends daily
Add capacity, overtime, or outsource
💡 Takt Time When Evaluating Contract Manufacturing Partners
Before signing with a contract manufacturer, ask for their current takt time and cycle time for your product type. If their cycle time already equals or exceeds takt time, their production is at capacity, your order will extend their lead time. GTsetu’s verified CM profiles include production capacity data so you can evaluate fit before engaging. For overflow capacity planning, also consider toll manufacturing arrangements.
SECTION 10
10 Material Lead Time & Cumulative Lead Time
🎯 Definition
Material lead time is the elapsed time between placing a purchase order for raw materials or components and receiving them ready for production. It is driven entirely by supplier performance and geography, not by anything within the manufacturer’s direct control. Cumulative lead time (CLT) is the total time to manufacture a product from scratch assuming zero existing inventory, the sum of material lead time and production time. CLT is the primary input for safety stock calculations: it tells you exactly how far in advance you must plan and order to avoid stockouts.
📐 Key Formulas
Material Lead Time=Date Materials Received−Date PO Placed
Cumulative Lead Time=Material Lead Time+Production Time
Safety Stock Implication: If CLT = 35 days and weekly demand = 100 units, safety stock should cover ≥5 weeks of demand to protect against unexpected demand spikes or supplier delays.
Material Lead Time by Sourcing Region
Sourcing Region
Typical Material Lead Time
Reliability
Cost Impact
GTsetu Strategy
Domestic / Local
1–7 days
🟢 Very High
🔴 Higher unit cost
Maximum lead time reduction; find local suppliers on GTsetu
Regional (e.g. intra-Asia)
7–21 days
🟡 High
🟡 Moderate
Best cost-vs-speed balance; GTsetu covers India, SEA, Middle East
China (standard)
21–45 days
🟠 Variable
🟢 Low
Lowest cost but longest variable MLT; requires strong safety stock
Long MLT demands robust demand forecasting and dual sourcing
SECTION 11
11 MTO vs MTS, How Production Strategy Affects Lead Time
The biggest structural variable in customer-facing lead time is the manufacturer’s production strategy: Make-to-Order (MTO) or Make-to-Stock (MTS). Understanding the difference is critical for setting accurate lead time expectations with international buyers and distributors, and for choosing the right white label or private label manufacturing model.
🔵 Make-to-Order (MTO)
Production only begins after a customer order is received. The customer-facing lead time includes both production time and shipping time, typically resulting in longer lead times.
Long lead times require distributors to forecast demand well in advance
🟢 Make-to-Stock (MTS)
Products are manufactured in advance and held as finished goods inventory. Customer-facing lead time is only the shipping/delivery time, days rather than weeks.
Fast replenishment enables smaller safety stock buffers at distributor level
💡 GTsetu for MTO Manufacturers Seeking Distributors
MTO manufacturers face a unique challenge: distributors want short lead times, but MTO production inherently requires longer ones. The solution is finding distributors who specialise in your product category and are accustomed to MTO lead time structures, and pairing MTO with regional buffer stock (held by the distributor) for standard SKUs. GTsetu helps you find verified international distributors and structure these arrangements transparently, with built-in NDA and collaboration workflows. See how distribution agreements can protect both parties in MTO scenarios.
SECTION 12
12 Master Comparison Table, All 7 Metrics Side-by-Side
Factor
Lead Time
Production Time
Throughput Time
Cycle Time
Takt Time
Material LT
Cumulative LT
What it measures
Order → customer delivery
Production start → finished goods
Raw material entry → finished goods exit (full factory time)
One production cycle or work step
Max time/unit to meet demand
PO placed → materials received
From-scratch mfg time (zero inventory)
Perspective
External / customer
Internal / factory
Internal / factory process
Internal / one workstation
Market-driven target
Supply chain / procurement
Planning / inventory
Formula
Delivery − Order date
Production end − start
Setup + Processing + Queue + Inspection
Net Production Time ÷ Units
Net Production Time ÷ Demand
Receipt date − PO date
Material LT + Production Time
Includes shipping?
✅ Yes
❌ No
❌ No
❌ No
❌ No
❌ No
❌ No
Includes queue/wait time?
✅ Yes (all of it)
✅ Yes (within production)
✅ Yes, explicitly includes all queue time
✅ Yes (at one station)
N/A, it is a target
✅ Yes (supplier side)
✅ Yes
Target or actual?
Actual (measured)
Actual (measured)
Actual (measured)
Both, Target CT and Actual CT
Target (market-set)
Actual (measured)
Planned (calculated)
Who uses it
Sales, distributors, buyers
Production managers
Lean engineers, ops managers
Process engineers, lean teams
Production planners
Procurement, supply chain
Supply chain planners, finance
Typical scale (B2B)
Weeks to months
Days to weeks
Hours to days
Minutes to hours
Minutes to hours
Days to weeks
Weeks to months
Reducing requires
All supply chain improvements
Lean manufacturing, capacity
Eliminate queue time, lean flow
Bottleneck elimination
Increase demand or reduce downtime
Nearshoring, dual sourcing, stock
Reduce both material LT + production
SECTION 13
13 What Factors Impact Lead Time?
Lead time is not a fixed property, it is the result of dozens of interacting variables across internal operations and external supply chain conditions. Understanding root causes is the prerequisite for reducing them.
Internal Factors (Within Your Control)
🏭
Production Capacity vs Takt Time
If actual cycle time exceeds takt time at any workstation, orders queue and lead times extend. Even one bottleneck workstation inflates lead time for every order in the system.
🔄
Process Inefficiencies
Unnecessary production steps, poor workflow design, excessive handoffs, and lack of SOPs increase throughput time. Lean manufacturing’s primary goal is eliminating non-value-adding time from the process.
📦
Inventory Management
Too little raw material stock causes production stoppages. Too much creates slow, capital-intensive systems. Optimal safety stock, based on cumulative lead time, minimises both risks simultaneously.
💬
Communication & Admin Lead Time
Slow order confirmation, design approval bottlenecks, credit review delays, and poor inter-departmental communication add invisible pre-production lead time before manufacturing even begins.
🔬
Defect Rate & Rework
High defect rates create rework loops that inflate both throughput time and production time. First-pass yield is a critical metric, every unit that fails inspection must be reworked or scrapped and remade.
⚙️
Equipment OEE & Reliability
Machine breakdowns and unplanned maintenance reduce net production time and increase cycle time. Low OEE (Overall Equipment Effectiveness) means less actual production capacity than nominal capacity suggests.
External Factors (Requiring Active Management)
🌏
Supplier Performance & Reliability
Late or defective material deliveries are the single most variable contributor to extended lead times. Supplier lead time reliability matters as much as quoted lead time, an unreliable 3-week supplier is worse than a consistent 5-week supplier.
🚢
Shipping & Logistics Delays
Port congestion, carrier capacity constraints, weather events, and carrier performance variability can add days to weeks to delivery lead time, especially for international sea freight routes.
📋
Customs & Regulatory Compliance
Missing or incorrect export documentation, wrong HS codes, or regulatory non-compliance can cause customs holds of 3–15 days, particularly for new trade lanes, controlled goods, or random inspection selection.
⚡
Market Disruptions
Geopolitical events, pandemics, natural disasters, and raw material shortages can dramatically and unpredictably extend material lead times and production capacity, requiring robust supply chain resilience strategies.
SECTION 14
14 How to Reduce Lead Time, 8 Proven Strategies
🎯 Where to Focus First: Lead Time Reduction Decision Guide
Material lead time is your biggest component…
→ Nearsource Suppliers
Procurement
Source from closer geography. Find verified regional suppliers on GTsetu across 100+ countries.
Throughput time has high queue/wait time…
→ Apply Lean Manufacturing
Operations
5S, value stream mapping, pull systems. Eliminate non-value-adding queue time, often 60–80% of throughput time.
Cycle time exceeds takt time at a workstation…
→ Eliminate Bottleneck
TOC
Theory of Constraints: subordinate everything to the bottleneck. Add capacity only at the constraint.
Production capacity at maximum for demand…
→ Contract Manufacturing
Outsource
Find verified contract manufacturers for overflow. Protect lead time commitments during demand peaks.
Shipping drives most of customer lead time…
→ Regional Distributors
Logistics
Hold buffer stock with a local verified distributor, shipping LT drops from weeks to days.
Map and Measure All Lead Time Components Separately
You cannot reduce what you do not measure. Break total lead time into every component (material, admin, production, throughput queue, QC, packaging, shipping, customs) and time each one. Most manufacturers are surprised to discover that production time is often only 30–40% of total customer lead time, the other 60–70% is logistics, procurement, and wait time.
2
Nearsource Critical Materials to Cut Material Lead Time
The fastest single lever for reducing total lead time is moving material sourcing closer. A 30-day reduction in material lead time directly reduces total lead time by 30 days. GTsetu’s global network covers verified suppliers across 100+ countries, enabling manufacturers to find nearshore options for raw materials, components, and sub-assemblies without the traditional discovery barriers.
3
Hold Safety Stock Based on Cumulative Lead Time
Carry buffer inventory of high-usage materials proportional to your cumulative lead time. This decouples your production from supplier variability, production starts immediately on receipt of an order, without waiting for procurement. Calculate: Safety Stock = (Maximum Daily Usage × Maximum Lead Time) − (Average Daily Usage × Average Lead Time).
4
Eliminate Throughput Time Queue Waste Using Lean Principles
In most manufacturing operations, queue and wait time accounts for 60–80% of throughput time, while actual value-adding processing time is only 20–40%. Value stream mapping identifies all non-value-adding time. Pull systems (kanban), one-piece flow, and cellular manufacturing eliminate batch-and-queue patterns that create most of the queue time.
5
Fix the Bottleneck Workstation Using TOC
Using Goldratt’s Theory of Constraints: identify the production step where cycle time most exceeds takt time. This is your system constraint, it determines throughput for the entire line. Every hour saved at the bottleneck saves an hour for the entire system. Every hour saved elsewhere is an illusion. Add capacity (labour, equipment, shifts) only at the proven constraint.
6
Run Process Steps in Parallel
Many manufacturers run activities sequentially when they could be concurrent: starting material pre-treatment while components are still in fabrication; booking freight while final production is underway; processing export documentation during QC inspection. Parallelising activities that have no hard sequential dependencies compresses total lead time without adding capacity.
7
Deploy Regional Distributors to Eliminate Shipping Lead Time for End Customers
For international B2B trade, the shipping component of lead time (15–35 days for sea freight) can be eliminated from the customer’s perspective by holding buffer stock with a local distributor. The manufacturer ships in bulk to the distributor (long lead time acceptable); the distributor delivers to end customers in days. This is the most impactful lead time strategy for manufacturers entering new export markets. Find verified distributors via GTsetu’s global network →
8
Expand via Joint Ventures, Technology Transfers, or Licensing
For manufacturers targeting regions where shipping lead time is structurally prohibitive (e.g., cross-continental trade), establishing local production capacity through joint ventures, technology transfer agreements, or franchise manufacturing models eliminates both shipping and customs lead time entirely, at the cost of higher upfront investment and local partner selection risk. GTsetu helps you find and verify potential JV and licensing partners globally.
SECTION 15
15 Lead Time Benchmarks by Industry
Lead time norms vary dramatically by industry, product complexity, and geography. These benchmarks represent typical international B2B trade ranges, actual figures vary based on specific products, regions, and supply chain configurations.
Industry
Typical Material LT
Typical Throughput Time
Production Time
International Shipping
Total Customer Lead Time
Primary LT Driver
Consumer Electronics
21–45 days
10–28 days
7–21 days
15–30 days (sea)
7–14 weeks
Semiconductor availability
Apparel & Textiles
14–30 days (fabric)
12–25 days
7–21 days
20–35 days (sea)
7–14 weeks
Seasonal demand peaks, custom printing
Industrial Machinery
30–90 days (custom parts)
18–70 days
14–60 days
10–30 days
10–24 weeks
Custom engineering & long production
Pharmaceuticals
30–60 days (API)
18–35 days (incl. batch testing)
14–30 days
5–15 days (air)
9–16 weeks
Regulatory QC batch release
Food & Beverage
7–21 days
3–8 days
1–5 days
15–30 days (reefer)
4–10 weeks
Perishability & shelf-life constraints
Automotive Components
14–45 days
5–18 days
3–14 days
20–35 days (sea)
7–14 weeks
JIT requirements, precision tooling
FMCG / Consumer Goods
14–30 days
5–14 days
3–10 days
20–35 days (sea)
7–12 weeks
Packaging customisation, label changes
Medical Devices
30–60 days (certified parts)
18–35 days
14–30 days
5–15 days (air)
10–18 weeks
Regulatory compliance, sterility testing
SECTION 16
16 GTsetu, Find Partners Who Deliver on Lead Time Commitments
🌐 Platform Spotlight, GTsetu
Verified Global Partners Whose Lead Time Capabilities Are Backed, Not Just Claimed
Lead time is only as reliable as the partners delivering it. A contract manufacturer who quotes 14-day throughput time but consistently delivers in 25 days destroys your commitments to distributors. A distributor who promises 2-day local delivery but lacks inventory management collapses your customer experience. GTsetu is the verified B2B discovery platform where manufacturers, contract manufacturers, suppliers, and distributors across 100+ countries connect, with multi-layer business verification, so lead time capabilities you see in a profile are credible. Zero broker commission means your entire commercial arrangement, including lead time SLAs, stays between you and your partner.
✅
Multi-Layer VerificationBusiness registration, certifications, and trade references verified, lead time capabilities are credible, not self-reported.
🕵️
Anonymous DiscoveryEvaluate verified profiles without revealing your identity until mutual interest is confirmed.
📄
Built-In NDA WorkflowProtect your product specs and lead time SLA terms before sharing, full audit trail included.
🚫
Zero CommissionNo broker fees. Your supply chain deal stays between you and your partner.
🌍
100+ CountriesFind nearshore suppliers to reduce material lead time, or regional distributors to cut shipping lead time.
🔐
Encrypted CollaborationShare production schedules, capacity, and throughput time data securely between verified partners.
JV / licensing / technology transfer partner discovery
✓ Supported
✗ Not available
FAQ
? Frequently Asked Questions
QWhat is the difference between lead time and production time?
Production time is the time to manufacture a product once all materials are available, factory floor only, from production order release to finished goods ready for shipment. Lead time is the broader customer-facing total: the elapsed time from order placement to delivery, encompassing material procurement, production, quality inspection, packaging, shipping, and customs clearance. Lead time always includes production time, but production time is only one component, typically 30–40%, of total customer lead time. Always specify which components are included when quoting lead time to buyers or distributors.
QWhat is throughput time and how does it differ from production time?
Throughput time is the total time an item spends inside the production system, from raw material entry to finished goods exit, including all processing time, setup time, queue/wait time between operations, and inspection time. Production time typically refers to the active manufacturing phase, but in common usage may or may not include queue time. The key distinction: throughput time explicitly includes queue and wait time as measurable components to be identified and eliminated, while “production time” often implies only active work. In lean manufacturing, reducing queue time within throughput time is the primary improvement lever.
QWhat is the difference between cycle time and takt time?
Takt time is the market-determined target: the maximum time allowed to produce one unit to meet customer demand. Formula: Net Production Time ÷ Customer Demand. Cycle time is the operational reality: how long it actually takes to produce one unit right now. If cycle time < takt time, production keeps pace with demand. If cycle time > takt time, production is falling behind, backlogs build and lead time extends. Additionally, cycle time is divided into target cycle time (planned, standard time) and actual cycle time (measured, real time). Comparing target to actual identifies production deviations and bottlenecks.
QHow does MTO vs MTS affect lead time for international buyers?
In Make-to-Order (MTO) manufacturing, production begins only after an order is received, so total customer lead time includes material procurement + production + shipping (6–16 weeks for international trade). In Make-to-Stock (MTS), finished goods are held as inventory, customer lead time is only the shipping/delivery time (1–4 weeks). MTO offers higher customisation but longer lead times; MTS enables faster delivery but requires accurate demand forecasting to avoid overstock or stockouts. International distributors strongly prefer MTS supply or MTO + local buffer stock arrangements. GTsetu can help you find regional distributors to hold buffer stock, effectively converting your MTO product to MTS at the distribution level.
QWhat is the lead time formula?
The key lead time formulas are: Customer Lead Time = Delivery Date − Order Date. For supply chain planning: Lead Time = Material Lead Time + Production Time + QC & Packaging + Shipping. For safety stock: Cumulative Lead Time = Material Lead Time + Production Time (assumes zero inventory). Each component should be timed separately to identify which drives the most delay, this determines where improvement investment will have the largest impact on total customer lead time.
QHow can a manufacturer reduce lead time when working with international partners?
Six key strategies for reducing international trade lead times: (1) Nearsource materials to reduce material lead time; (2) Hold safety stock based on cumulative lead time calculations; (3) Deploy regional distributors (verified via GTsetu) who hold local buffer stock, eliminating shipping lead time for end customers; (4) Use contract manufacturers for overflow capacity during demand peaks; (5) Dual-source critical components for supply chain resilience; (6) Explore JV or technology transfer for markets where shipping lead time is structurally prohibitive. GTsetu addresses strategies 3, 4, 5, and 6 through its verified global B2B network.
QHow does MOQ relate to lead time?
Minimum Order Quantity (MOQ) and lead time are closely linked in manufacturing scheduling. Higher MOQs typically mean longer production runs, which can extend production time per order but improve unit economics. Very low MOQ orders may be deprioritised in a factory’s production queue, causing longer wait times and counterintuitively longer actual throughput time. When negotiating with new manufacturing partners, always discuss MOQ, takt time, and lead time together, the optimal structure balances production efficiency with supply chain responsiveness for your specific order volumes.
QWhat is a good lead time benchmark for B2B manufacturing?
“Good” lead time is industry-specific. Consumer electronics: 7–12 weeks. Apparel: 8–14 weeks. Industrial machinery: 10–20 weeks. FMCG: 6–10 weeks. The most commercially important property of lead time is not absolute speed, it is consistency and predictability. A manufacturer who reliably delivers in 10 weeks every time is far more valuable to a distributor than one who promises 6 weeks but delivers anywhere from 4 to 14 weeks. Predictable lead times enable accurate inventory planning; variable lead times force distributors to hold excessive safety stock buffers or risk stockouts, both of which reduce your competitive attractiveness as a supplier.
Find Verified Partners Who Deliver on Every Lead Time Commitment
Join 500+ manufacturers, contract manufacturers, suppliers, and distributors on GTsetu, verified across 100+ countries, zero broker fees, built-in NDA workflows. Reduce material lead time with nearshore suppliers. Protect production lead time with verified CMs. Eliminate shipping lead time with regional distributors.
They represents the product, and research team behind GTsetu, a global B2B collaboration platform built to help companies explore cross-border partnerships with clarity and trust. The team focuses on simplifying early-stage international business discovery by combining structured company profiles, verification-led access, and controlled collaboration workflows.
With a strong emphasis on trust, and disciplined engagement, Team GTsetu shares insights on global trade, partnerships, and cross-border collaboration, helping businesses make informed decisions before entering deeper commercial discussions.