The True Cost of Global Expansion for Manufacturers & Distributors
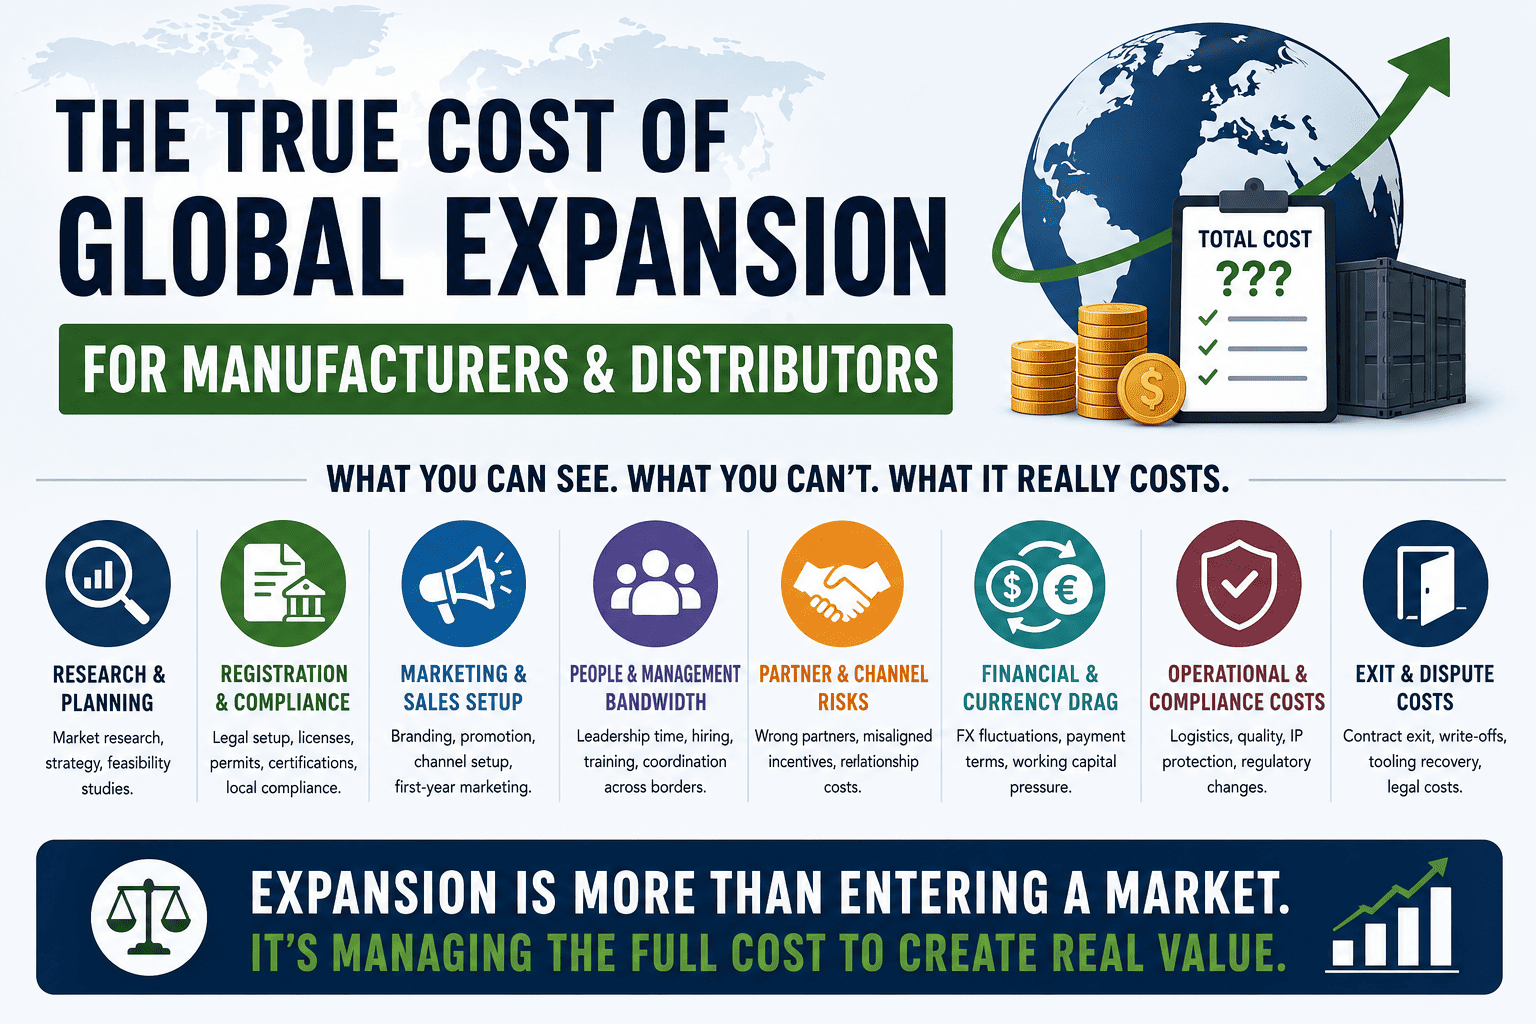
Most manufacturers and distributors budget for global expansion the way a first-time traveller packs: the visible items make it into the bag, the rest gets bought expensively at the destination. Research, registration fees, and first-year marketing appear in the spreadsheet. Management bandwidth consumed, wrong partner costs, currency drag, compliance drift, tooling disputes, and the cost of market exit do not, until they arrive. This guide covers the full cost picture of international expansion: what you can see, what you cannot, and what structural decisions determine whether expansion builds commercial value or quietly destroys it.
📅 June 1, 2026⏱ 19 min read✍️ GTsetu Editorial🔄 Updated regularly
32%
Average Cost Gap vs. Budget
70%
Expansions Fail Year 1–2
25–30%
Contingency Successful Cos. Budget
$800M
SMB Hidden FX Fees (2023)
The decision to expand internationally is one of the most commercially significant a manufacturer or distributor makes. It is also one of the most expensively misunderstood. Companies that have done the market research, written the business case, and secured internal approval frequently discover, twelve to eighteen months into execution, that actual costs are 30 to 50 percent above budget. Not because they were reckless, but because the costs that ambush international expansion are structurally different from the costs that appear in any budget model built from a domestic perspective.
Data consistently confirms the pattern: companies budget an average of 68 percent of what international expansion actually costs, leaving a 32 percent funding gap that surfaces during execution. The most successful expansions, those achieving profitability within twelve months in a new market, allocated 42 percent more to operational infrastructure than their less successful counterparts, and budgeted 25 to 30 percent for contingencies versus the 12 percent contingency reserve that struggling expansions used. The gap between these two groups is not ambition or product quality. It is understanding the true cost picture before committing to it.
💡 Who this guide is for
This guide is written for manufacturers, distributors, and industrial businesses planning or early in international expansion. It covers both the financial costs, visible and hidden, and the structural decisions that determine whether those costs deliver sustainable commercial value or accumulate as sunk cost. It is not a guide to whether you should expand internationally. It is a guide to understanding what it will actually cost when you do.
Section 1
1 The Gap Between What You Budget and What Expansion Actually Costs
International expansion cost overruns are not random. They follow a consistent pattern because the costs that are easiest to estimate, legal fees, registration costs, initial marketing spend, are also the smallest portion of the true total. The costs that are hardest to estimate, management time, partner failure, compliance drift, currency erosion, are the largest, and the ones most consistently left off the initial budget.
68%
Average percentage of true expansion cost that companies budget for, leaving a 32% gap that appears during execution
42%
More operational infrastructure investment made by companies that achieve profitability within 12 months vs. those that do not
7.2%
Average percentage of expansion budget consumed by currency fluctuation impacts alone, invisible until it is measured
The pattern is consistent across sectors and company sizes. A manufacturer entering a new international market through a distribution arrangement expects to pay for market research, a lawyer to review the distributor agreement, some product adaptation, initial marketing materials, and perhaps a trade show visit. What they do not budget for: the three months of senior management time spent finding and evaluating distributors before selecting one; the cost of discovering six months in that the selected distributor is underperforming and must be replaced; the 3–5% currency conversion cost on every payment received from that distributor; the compliance obligation in the destination country that was not identified until the first shipment arrived; or the dispute over who owns the tooling that was shared with the distributor’s manufacturing partner.
⚠️ The 70% failure rate
Approximately 70% of international expansions fail within the first two years. The primary cause is not product-market fit, most manufacturers who commit to international expansion have validated their product. The primary causes are undercapitalisation (the 32% budget gap arriving mid-expansion), wrong partner selection, inadequate legal framework, and management bandwidth being stretched across too many markets simultaneously before any of them are profitable.
Section 2
2 Visible Costs: What Makes It onto the Spreadsheet
The visible costs of global expansion are the ones that appear in the initial business case. They are real costs, often significant ones, but they are also the easiest to research, the most commonly discussed, and therefore the ones that receive the most budgetary attention relative to their actual share of total expansion cost.
Phase-by-Phase Cost Breakdown
Phase 1 · Market Entry
Research & Legal Setup
Market research and feasibility studies
Legal entity registration (where required)
Banking account setup, often harder than incorporation
Initial legal and advisory fees
Regulatory and product compliance review
Trademark and IP registration in new jurisdiction
Typical range: $20,000–$150,000 per market
Phase 2 · Partner & Supplier
Partner Discovery & Onboarding
Partner search and evaluation (time, travel, advisory)
Due diligence on distributor or manufacturing partner
Partner onboarding, training, samples, technical support
Initial inventory or tooling investment
Typical range: $15,000–$80,000 per partner
Phase 3 · Market Operations
First-Year Operating Costs
Marketing materials and localisation
Trade show participation and customer visits
Product certifications for destination market
Logistics, customs, and freight setup
Insurance, product liability, credit, cargo
Typical range: $30,000–$120,000 first year
Phase 4 · Ongoing Compliance
Annual Operational Overhead
Annual legal entity maintenance and filings
Tax compliance and advisory in each jurisdiction
Employment and payroll compliance (where applicable)
Regulatory renewal and product re-certification
Annual accounting, audit, and corporate secretarial
Typical range: $25,000–$100,000 per market annually
📌 Entity vs. distribution partnership
The most significant visible cost decision in any international expansion is whether to establish a legal entity in the target market or enter through a distribution partnership. Entity setup costs $20,000–$150,000 upfront and commits you to ongoing annual compliance costs regardless of market performance. A distribution partnership, structured through a formal manufacturer-distributor agreement, can achieve market entry at a fraction of this cost while keeping fixed overhead minimal until the market is validated. For most industrial manufacturers, the distribution partnership model is the correct first-market-entry structure, entity setup follows market validation, not the other way around.
Section 3
3 Hidden Costs: What Ambushes You After Commitment
The hidden costs of global expansion are not obscure. They are well-documented by companies that have been through the process. What makes them “hidden” is not that they are unknown in principle but that they are consistently excluded from pre-expansion budgets because they are harder to quantify, appear only after execution is underway, and are not visible in the initial business case model.
🏦
Banking and FX Conversion Costs
International business banking typically involves higher account maintenance fees, international wire fees, and FX conversion markups on every payment received from a foreign market. The displayed exchange rate and the rate actually applied to your payment are rarely the same. Small and medium-sized businesses lost nearly $800 million in hidden international payment fees in 2023 alone. Currency fluctuation impacts consume an average 7.2% of expansion budget, an ongoing margin erosion that never appears in the original business case.
High impact, every transaction
⚖️
Compliance Drift and Regulatory Change
Regulations change. VAT rules, employment law, product safety standards, labelling requirements, and import procedures are all subject to revision, in multiple jurisdictions simultaneously. Staying current across markets requires either dedicated internal resource or ongoing advisory retainers. Regulatory changes requiring rapid adaptation cost an average of $12,700 per occurrence in missed adjustments and emergency advisory costs. The more markets you operate in, the higher this annual ongoing liability.
Medium-high, compounds over time
🌍
Cultural Misalignment Costs
Marketing campaigns that do not translate, literally or culturally, for new markets require redevelopment at an average cost of $6,300 per incident. Product positioning, pricing strategy, sales approach, and even the commercial relationship norms that work in one market may actively undermine your credibility in another. The cost of cultural misalignment is not just the recovery spend; it is the market-entry timeline lost while the misalignment is discovered and corrected.
Medium, often underestimated
✈️
Travel and Physical Relationship Cost
International business relationships, particularly at the distributor principal level, require face-to-face engagement at key moments: partner selection, agreement negotiation, market launch, performance review, and crisis management. Emergency travel for key personnel averages $8,400 per occurrence. For manufacturers with partners across multiple markets, annual travel budgets for international relationship maintenance are frequently three to five times higher than the pre-expansion estimate.
Medium, escalates with market count
🔒
IP and Data Compliance Costs
Operating in new markets often requires adapting technology infrastructure for local data protection laws (GDPR in Europe, PDPA in Southeast Asia, POPIA in South Africa). Product IP registration in each new jurisdiction is a prerequisite for enforcing rights. Where technology is shared with a partner, software, manufacturing processes, technical documentation, protecting that IP requires both legal framework and secure sharing infrastructure. The cost of inadequate IP protection is typically discovered only after an incident, when the cost is orders of magnitude higher.
High if neglected
🔄
Entity Exit and Wind-Down Costs
Dissolving a foreign entity is more expensive and slower than establishing one. Germany’s liquidation process includes a mandatory one-year creditor waiting period. Portugal’s entity dissolution can take up to three years. UK entity closure costs range from £10 (solvent strike-off) to £4,000+ (insolvent liquidation). During the wind-down period, annual filing, compliance, and maintenance costs continue. For expansions that do not deliver market validation, exit costs are the final bill that was never in the original budget.
Significant, often not modelled
Section 4
4 The True Cost of the Wrong Partner
Of all the hidden costs in global expansion, the cost of selecting the wrong international partner, a distributor who underdelivers, an agent who misrepresents your product, a manufacturing partner who compromises quality, is the most consistently underestimated and the most damaging. It is also the most preventable with the right partner discovery and verification process.
What Wrong Partner Selection Actually Costs
The visible cost of a failed distributor relationship is the loss of revenue from an underperforming market. The true cost is significantly higher:
⏰
Time to Discovery
Most distributor performance problems are not visible for 6–12 months, the honeymoon period of initial orders and relationship establishment. By the time underperformance is clear, a full year of market opportunity has been lost in a market window that may be time-sensitive.
🔄
Replacement Cost
Finding, evaluating, onboarding, and training a replacement distributor incurs almost the full cost of the original partner selection process, due diligence, contract negotiation, product training, initial inventory support, all compressed into a timeline where urgency increases both cost and error risk.
📋
Contract Termination Risk
Poorly structured distributor agreements, without performance milestones and clear termination provisions, can make exiting a non-performing distributor relationship legally complex and expensive, particularly in markets with strong distributor protection law (many EU countries, Middle East markets). See our guide on manufacturer-distributor contract structures for how to build exit provisions in from the start.
🌐
Market Reputation Damage
A distributor who misrepresents your product, provides poor after-sales support, or engages in grey market activity does not just underperform commercially, they damage your brand in the market you are trying to build, making it harder and more expensive for the replacement distributor to establish your product’s position.
💰
Exclusivity Opportunity Cost
A distributor granted exclusive territory who does not develop the market locks out better alternatives for the duration of the exclusivity period. The cost is not just the underperformance, it is the market opportunity that could have been captured by a competitor or a better distributor during the same period.
⚠️
Regulatory and Compliance Exposure
In some markets, a distributor who misclassifies your product for customs purposes, makes false claims in marketing materials, or fails to meet product safety requirements can create legal liability for the manufacturer, even without direct involvement. Inadequate distributor due diligence is a compliance risk as well as a commercial one.
The total cost of a wrong partner selection, including time to discovery, replacement process, exclusivity opportunity cost, and reputational recovery, consistently exceeds the entire first-year visible expansion budget for that market. It is also the single most preventable cost in global expansion: rigorous partner verification and evaluation before commitment eliminates most of the risk. Read our full framework on partnership evaluation criteria for a structured approach to partner selection that prevents this cost from occurring.
💡 The verification gap
Most manufacturers discover their distributor’s weaknesses through commercial performance, not through pre-selection due diligence. Verification of a partner’s actual business registration, legal standing, and commercial track record before selection, rather than relying on self-reported profiles, LinkedIn presence, or trade show introductions, is the single highest-ROI investment in the partner selection process. See also our guide on verified B2B matchmaking tools for how platform-level verification changes the partner selection cost profile.
Section 5
5 Tooling, Moulds, and IP: The Costs Nobody Talks About
For manufacturers who work with international manufacturing partners, contract manufacturers, or distributors who also manage production, one of the most significant and least-discussed cost risks in global expansion is the ownership of physical tooling, moulds, dies, jigs, fixtures, and the intellectual property embedded in product designs and manufacturing processes.
The Tooling Ownership Problem
When a manufacturer engages an overseas factory to produce goods, or shares product designs with a manufacturing partner in a new market, the question of who owns the physical tooling used to produce those goods is not always legally clear, and it is almost never commercially comfortable. Tooling paid for by the manufacturer but held at the partner’s facility creates immediate dependency: if the relationship breaks down, the tooling may be held as leverage by the manufacturing partner, or its ownership may be disputed.
Our detailed guide on who owns tooling and moulds covers the full legal and commercial framework for establishing tooling ownership in international manufacturing arrangements, including the contract provisions that protect manufacturers’ rights, the risks of informal ownership arrangements, and the remedies available when ownership is disputed. The cost of a tooling dispute, in legal fees, lost production time, and relationship damage, typically dwarfs the cost of establishing clear ownership provisions in the original contract.
IP Exposure in International Manufacturing and Distribution
Sharing product specifications, technical documentation, and proprietary manufacturing processes with an international partner before establishing a legally executed NDA and clear IP ownership framework is one of the most common and most expensive mistakes in international expansion. In markets with weaker IP enforcement, or where the partner is also a competitor or potential competitor, the commercial damage from IP exposure can be permanent.
The costs of IP exposure in international manufacturing arrangements include: direct product copying by the partner or their sub-contractors; introduction of competing products based on your designs into adjacent markets; loss of competitive advantage in the shared technology that was the basis for entering the partnership; and legal costs of pursuing IP remedies across international jurisdictions, where enforcement is typically slow and expensive.
🔧
Never Share Tooling Without Written Ownership
Every mould, die, jig, or fixture paid for by your business must be covered by a written tooling ownership agreement specifying title, location, permitted use, access rights on termination, and the process for physical return or buyout. Verbal agreements are unenforceable across jurisdictions.
📄
NDA Before Any Technical Disclosure
Product drawings, specifications, manufacturing process documentation, and proprietary formulations must be shared only under a legally executed NDA. The NDA must specify scope, duration, permitted recipients, and cross-border jurisdiction for disputes. An NDA signed in one country may not be directly enforceable in another without careful drafting.
🌐
Register IP in Each Market Before Disclosure
Trademark registration, patent filing (where applicable), and design registration in the target market should precede any commercial activity or partner engagement in that market. Filing after engaging a partner, or after commercial activity has begun, risks prior use claims by the partner or third parties who became aware of the product through commercial channels.
🔐
Use Encrypted Document Infrastructure
Technical documents shared via email attachments or open links are not protected once sent. Encrypted document-sharing platforms with access audit trails, which record who accessed what and when, provide both practical security and evidentiary documentation in the event of a dispute. This is not a luxury for high-stakes manufacturers; it is standard practice.
Section 6
6 Currency and Payment Cost: The Margin You Never See Leave
Currency risk in international expansion is not a single event, it is a continuous, slow erosion of international margins that most manufacturers do not measure explicitly until they are reporting consolidated financial results and discovering that international revenue looks less attractive in their home currency than the underlying commercial performance would suggest.
Three Forms of Currency Cost
💱
Transaction Risk
The risk that the exchange rate moves between the time a contract is agreed (in a foreign currency) and the time payment is received. A 5% movement in exchange rate over a 90-day payment term eliminates the margin on a 5% net margin product entirely. For manufacturers selling on credit terms into international markets, this is a direct and ongoing P&L risk.
📊
Translation Risk
When international subsidiaries or overseas operations report in local currency, consolidating those results into the parent company’s reporting currency creates translation risk, gains and losses that appear on the balance sheet as exchange rate movements rather than operational performance, but affect reported profitability and net assets.
🌐
Economic Risk
The long-term risk that exchange rate movements affect the competitiveness of your products in international markets. If your home currency appreciates significantly against the currency of your target market, your products become more expensive in local currency terms without any change in your pricing, eroding market share and distributor margin simultaneously.
💸
Conversion and Transfer Fees
Every international payment involves conversion fees, wire transfer charges, and spread between the interbank rate and the rate applied to your specific transaction. Banks and traditional payment providers typically apply a 1.5–4% spread above interbank rates. For a manufacturer receiving $500,000 annually from international distributors, this represents $7,500–$20,000 in annual conversion cost that never appears as a line item but directly reduces net international margin.
📌 FX derivatives surged 20% in 2025
Use of foreign exchange hedging instruments, forward contracts, options, multi-currency accounts, increased 20% year-on-year in 2025 as manufacturers responded to the impact of global tariff volatility and exchange rate movements on international margin. For manufacturers with significant and recurring international revenue, establishing a basic FX risk management policy, even if only a forward contract on the primary currency of international trade, is now standard practice rather than a sophisticated treasury exercise.
Section 7
7 Management Bandwidth: The Costliest Hidden Cost of All
The cost that most consistently fails to appear in international expansion budgets is also the most significant: the diversion of senior management attention from the existing, profitable business to the new, uncertain international one.
International expansion demands disproportionate management time relative to its initial revenue contribution. Partner search, due diligence, agreement negotiation, partner onboarding, regulatory navigation, compliance management, performance monitoring, and crisis response all require the involvement of senior people, precisely the people whose time is most valuable to the core business. The opportunity cost of a CEO or commercial director spending 40% of their time on international expansion in year one is measured not in direct cost but in the domestic business decisions not made, the domestic customer relationships not developed, and the domestic operational improvements not implemented during that period.
📉
The Core Business Neglect Risk
The companies that manage international expansion most effectively ring-fence international management responsibility from domestic management responsibility from the outset, not because they have unlimited resources, but because allowing international complexity to drain senior attention from the profitable domestic operation is one of the primary ways that an otherwise-sound expansion strategy destroys value for the overall business.
🌍
Multi-Market Complexity Multiplication
Management bandwidth does not scale linearly with number of markets. The complexity of managing two international partnerships is not double the complexity of managing one, it is typically three to four times more complex, due to the coordination overhead, conflicting time zones, different regulatory environments, and the risk that a crisis in one market consumes the attention that should be going to all others simultaneously.
🤝
The Partner Quality Substitution Effect
When management bandwidth is insufficient to conduct proper partner due diligence before selection, companies substitute process quality with speed, choosing the first plausible distributor candidate rather than the best-verified one. This is a direct link between management bandwidth constraint and wrong partner cost: bandwidth pressure in the selection phase produces the partner failure cost in the execution phase.
🔧
Infrastructure Investment as a Bandwidth Substitute
The most effective way to reduce management bandwidth cost is to invest in infrastructure that reduces the per-market management overhead: verified partner discovery platforms that eliminate unverified cold outreach, structured partner evaluation frameworks that systematise the selection process, and digital agreement and document infrastructure that removes the administrative friction from each commercial engagement. These are the investments that enable multi-market expansion without proportional management team growth.
Section 8
8 Cost by Entry Mode: Comparing the Structures
The market entry mode you choose is the single largest structural determinant of total expansion cost. The same market can be entered at dramatically different cost levels depending on whether you use a direct entity, a distribution partnership, a joint venture, or a representative office. Understanding the full cost profile of each mode, not just the visible setup cost, is essential to making the right structural choice for each market at each stage of expansion.
Entry Mode
Setup Cost
Annual Compliance Cost
Management Overhead
Exit Cost
Best For
Distribution Partnership
$5,000–$30,000 (agreement, due diligence)
Low, minimal local compliance obligations
Low-Medium, partner management vs. direct operations
Low, agreement termination per contract terms
Initial market validation in most industrial categories
Sales Agent / Representative Office
$10,000–$40,000
Medium, potential PE risk, payroll compliance
Medium, agent oversight and coordination
Medium, employment termination, potential PE liability
Markets where buyer relationships require local presence before entity setup
Branch Office
$15,000–$60,000
Medium-High, local tax, reporting, compliance
High, direct management required
Medium-High, formal closure process required
Markets with moderate regulatory complexity and growing revenue
Wholly Owned Subsidiary
$20,000–$150,000
High, full local corporate compliance
Very High, full entity management
High, 3 months to 3+ years, significant legal cost
Validated markets with sustained, significant revenue justifying fixed cost
Joint Venture
$30,000–$200,000+
High, shared entity compliance plus JV governance
Very High, JV governance and partner alignment
Very High, JV dissolution complex and expensive
Markets where local ownership, capital, or market access requires a partner entity
The distribution partnership model, properly structured through a formal cross-border business partnership framework, offers the most favourable cost profile for initial market entry in most industrial sectors. It minimises fixed compliance overhead, preserves exit optionality, keeps management overhead proportional to market performance, and allows the manufacturer to test market assumptions before committing to the fixed cost base of a full entity. For manufacturers building multi-market distributor networks, this is the standard architecture, see our guide on building and managing a distributor network for the full framework.
Section 9
9 How to Reduce the Cost of Global Expansion Without Reducing Ambition
The goal of cost management in international expansion is not to reduce ambition, it is to ensure that the cost of achieving expansion objectives is proportional to the commercial value those objectives deliver. The manufacturers that expand most cost-effectively are not the ones that spend least; they are the ones that spend correctly: eliminating preventable costs, deferring costs that do not yet deliver value, and investing early in the infrastructure that reduces per-market overhead at scale.
1
Choose the Right Entry Mode for the Market Stage
Do not establish a legal entity in a market that has not yet been validated by commercial performance. The distribution partnership model is almost always the correct first structure for industrial manufacturers entering new international markets. Entity setup follows market validation, it does not precede it. Review the cross-border business partnership framework for the structural decisions that determine cost profile at each market stage.
2
Invest in Partner Verification Before Selection, Not After Failure
The cost of verifying a partner’s legal standing, business registration, and commercial track record before selection is a fraction of the cost of discovering a problem after onboarding. Use verified partner discovery platforms rather than cold outreach or unverified directory listings. Structured partner evaluation criteria and platform-level verification eliminate the largest single hidden cost in international expansion before it occurs.
3
Structure Contracts with Cost-Protective Provisions from Day One
Performance milestones, time-limited exclusivity review clauses, and clear termination provisions are not aggressive negotiating positions, they are the provisions that make international expansion commercially recoverable if a partner underperforms. The business partnership contract framework and manufacturer-distributor agreement guide cover the specific provisions that protect cost recovery at every stage of a distributor relationship.
4
Establish Tooling and IP Ownership Before Any Technical Disclosure
Ownership of moulds, dies, designs, and process IP must be established in writing before sharing any technical information with a manufacturing or distribution partner. Review our guide on who owns tooling and moulds for the specific contractual provisions required. Use encrypted document-sharing infrastructure for all technical disclosure, not email attachments. The cost of establishing these protections is trivial compared to the cost of an IP dispute across international jurisdictions.
5
Phase Market Entry Rather Than Launching Multiple Markets Simultaneously
Multi-market simultaneous entry multiplies management overhead non-linearly. The companies that scale international operations most cost-effectively validate one market architecture, partner model, pricing structure, compliance framework, logistics model, before replicating it in adjacent markets. Our global collaboration examples demonstrate how successful international partnerships scale from one validated market to a multi-country network without proportional overhead growth.
6
Engage International Business Development Expertise Early
The cost of engaging an international business development consultant before market entry, to identify the right entry structure, validate the partner landscape, and establish the commercial framework, is consistently recovered through avoided mistakes within the first year. The cost of not engaging expertise early is typically discovered only after an expensive structural error has already been made.
7
Use Technology to Reduce Per-Market Compliance and Admin Cost
Modern platforms reduce administrative compliance costs by 30–40% through automation. For multi-market manufacturers managing indirect tax filings, partner communication, and commercial document exchange across multiple jurisdictions, the platform investment pays back through reduced administrative overhead and reduced error-driven penalty exposure. This applies to partner discovery platforms, tax compliance tools, and technology partnership infrastructure for digital commercial operations.
💡 Budget for the full picture
Add 25–30% to your visible expansion budget as a contingency reserve for currency movements, regulatory changes, partner onboarding delays, and the management time overhead that initial planning consistently underestimates. This is not pessimism, it is the difference between the 30% of expansions that achieve profitability within 12 months and the 70% that do not. The contingency reserve that successful expansions maintain is not unspent; it is deployed against the costs that were always coming but were not in the original line items.
Section 10
10 GTsetu: Reducing the Partner Discovery and Engagement Cost of Global Expansion
The single highest-impact cost reduction available to manufacturers and distributors in international expansion is eliminating the preventable costs of wrong partner selection: the time spent on unverified candidates, the management overhead of onboarding a distributor who is later replaced, the legal cost of terminating a poorly structured agreement, and the market opportunity cost of the time between entering a market and finding the right partner to develop it.
GTsetu addresses this cost category directly. It is a verified B2B partnership platform for industrial manufacturers, distributors, and raw material suppliers, built to make partner discovery faster, partner verification rigorous, and partner engagement structured and secure. The platform’s government-sourced verification, anonymous browse, NDA workflow, and encrypted document infrastructure reduce the three largest hidden costs in partner engagement: time to verified shortlist, legal exposure from premature technical disclosure, and the management overhead of unstructured multi-market outreach.
🌍 Partner Discovery & Verification
GTsetu: The Verified Partnership Platform That Reduces the Largest Hidden Costs of Global Expansion
Wrong partner selection, inadequate IP protection, and unstructured commercial engagement are the three highest-cost hidden risks in international expansion. GTsetu addresses all three: every company on the platform is verified on 6 government-sourced points before engagement; discovery is anonymous, protecting your commercial strategy; NDAs are executed digitally before any sensitive information is shared; and all document exchange happens through encrypted infrastructure with a full audit trail. Zero commission on any partnership formed, your deal economics remain entirely your own.
🏛️
6-Point Government-Sourced Verification
Name, Address, Registration Number, Company Status, Company Type, and Date of Incorporation verified via government tie-ups, before any engagement begins. The due diligence cost that was previously a manual, time-consuming exercise is built into the platform.
🕵️
Anonymous Partner Discovery
Browse verified manufacturers and distributors across 100+ countries without revealing your identity or commercial strategy. Protect your market entry timing while shortlisting the right partners, eliminating the cost of competitive intelligence leakage during partner search.
📄
Built-In NDA Workflow
Digital NDA with timestamped signatures executed before any pricing, product specifications, or technical documentation is shared. Eliminates the IP exposure cost that occurs when technical disclosure precedes formal legal protection.
🔐
Encrypted Document Workspace
Product specifications, tooling documentation, and commercial proposals shared through AES-256 encrypted channels with a full access audit trail. Not email attachments. Not open links. Documented, traceable, protected, providing the evidentiary record that IP disputes require.
🌍
100+ Countries, One Platform
Verified manufacturers and distributors across all major expansion markets, from the UAE and Germany to Vietnam, Australia, Turkey, and Africa. One platform, one verification standard, one engagement process, reducing the per-market management overhead of running parallel partner searches across different channels.
🚫
Zero Commission
No broker fee, no success commission, no percentage of partnership value. Every rupee of commercial margin from an international partnership remains entirely between you and your partner, not shared with an intermediary whose incentives may not align with partnership quality.
QWhat is the true cost of global expansion for a manufacturer?
The visible costs, market research, legal entity setup, initial compliance, marketing materials, typically represent around 68% of what global expansion actually costs, leaving a 32% gap that emerges during execution. Total first-year expansion costs per market for an industrial manufacturer using a distribution partnership model typically range from $50,000 to $250,000, depending on market complexity, product certification requirements, and partner onboarding depth. For manufacturers establishing a full legal entity in the target market, add $20,000–$150,000 in setup cost and $25,000–$100,000 in annual ongoing compliance cost on top of the commercial expansion spend. The largest costs are frequently management bandwidth (opportunity cost of senior time), wrong partner selection, and currency conversion drag, none of which typically appear in the initial business case.
QWhat are the biggest hidden costs of international expansion?
The five consistently underestimated hidden costs are: (1) the cost of wrong partner selection, including time to discovery, replacement cost, exclusivity opportunity cost, and reputational recovery, which together often exceed the entire visible first-year expansion budget; (2) management bandwidth, the opportunity cost of senior time diverted to international complexity; (3) currency drag, the ongoing margin erosion from exchange rate movements and conversion fees, averaging 7.2% of expansion budget annually; (4) compliance drift, the accumulating cost of staying current with regulatory change across multiple jurisdictions; and (5) entity exit, the legal cost and timeline of closing a foreign entity if the market does not perform. Hidden costs can add 15–25% to the visible expansion budget, even before contingency events are considered.
QHow can I reduce the cost of entering an international market?
The highest-impact cost reductions are structural, not tactical: (1) use distribution partnerships rather than entity setup for initial market entry, this single decision reduces setup cost by $50,000–$150,000 and eliminates ongoing compliance overhead until market validation; (2) invest in verified partner discovery to eliminate the wrong-partner cost before it occurs; (3) use structured evaluation criteria and formal partner agreements with performance milestones and exit provisions from day one; (4) establish tooling and IP ownership provisions before any technical disclosure; and (5) phase multi-market expansion sequentially rather than simultaneously to prevent management bandwidth overextension. GTsetu’s platform addresses the partner discovery and engagement cost directly, verified companies, anonymous browse, built-in NDA, encrypted documents, zero commission, reducing both the cost and the risk of the partner selection process across 100+ countries.
QWho owns tooling and moulds when working with an international manufacturing partner?
Tooling ownership is determined by the contract, not by who paid for it, who holds it, or who uses it. Without a written tooling ownership agreement, ownership may default to the party in physical possession under some jurisdictions’ law, or may be disputed. Our guide on who owns tooling and moulds covers the specific contract provisions required to establish manufacturer ownership, protect rights on relationship termination, and establish the process for physical return or financial settlement of tooling. Every international manufacturing arrangement should include explicit tooling ownership provisions before any tooling is procured or transferred.
QWhat is the cost of establishing a legal entity in an international market?
Initial entity setup costs typically range from $20,000 to $150,000, covering incorporation, banking setup, initial legal advisory, share capital requirements (where applicable), and compliance registrations. Ongoing annual costs, accounting, tax filing, corporate secretarial, registered office, director compliance, and payroll administration where applicable, typically range from $25,000 to $100,000 per market per year, regardless of the entity’s trading activity. Dissolving a foreign entity adds a further $5,000–$50,000+ in legal and administrative cost, with mandatory waiting periods of one to three years in some jurisdictions. For manufacturers entering markets through distribution partnerships rather than entities, these costs are deferred until market validation justifies the fixed overhead commitment.
QHow do I find verified international distributors without the cost and risk of cold outreach?
The most cost-effective approach to international distributor discovery is using a verified partner platform rather than cold outreach, trade directories, or trade show meetings alone. GTsetu provides verified manufacturer and distributor profiles across 100+ countries, with each company verified on 6 government-sourced data points before appearing on the platform. Anonymous browse lets you evaluate potential partners without revealing your commercial strategy. Built-in NDA execution and encrypted document infrastructure mean that when you engage a shortlisted partner, the process is protected from the first interaction. This eliminates the management cost of evaluating unverified candidates and reduces the risk of the largest hidden cost in global expansion: selecting the wrong partner. See our guide on international wholesale distributors and the B2B matchmaking tool guide for more on how verified platform discovery changes the partner selection cost profile.
Expand Internationally Without Paying the Hidden Costs
GTsetu gives manufacturers, distributors, and industrial businesses the verified partner discovery platform, NDA infrastructure, and encrypted document workspace that eliminate the largest preventable costs in global expansion, across 100+ countries, with government-sourced partner verification and zero commission on partnerships formed.
They represents the product, and research team behind GTsetu, a global B2B collaboration platform built to help companies explore cross-border partnerships with clarity and trust. The team focuses on simplifying early-stage international business discovery by combining structured company profiles, verification-led access, and controlled collaboration workflows.
With a strong emphasis on trust, and disciplined engagement, Team GTsetu shares insights on global trade, partnerships, and cross-border collaboration, helping businesses make informed decisions before entering deeper commercial discussions.