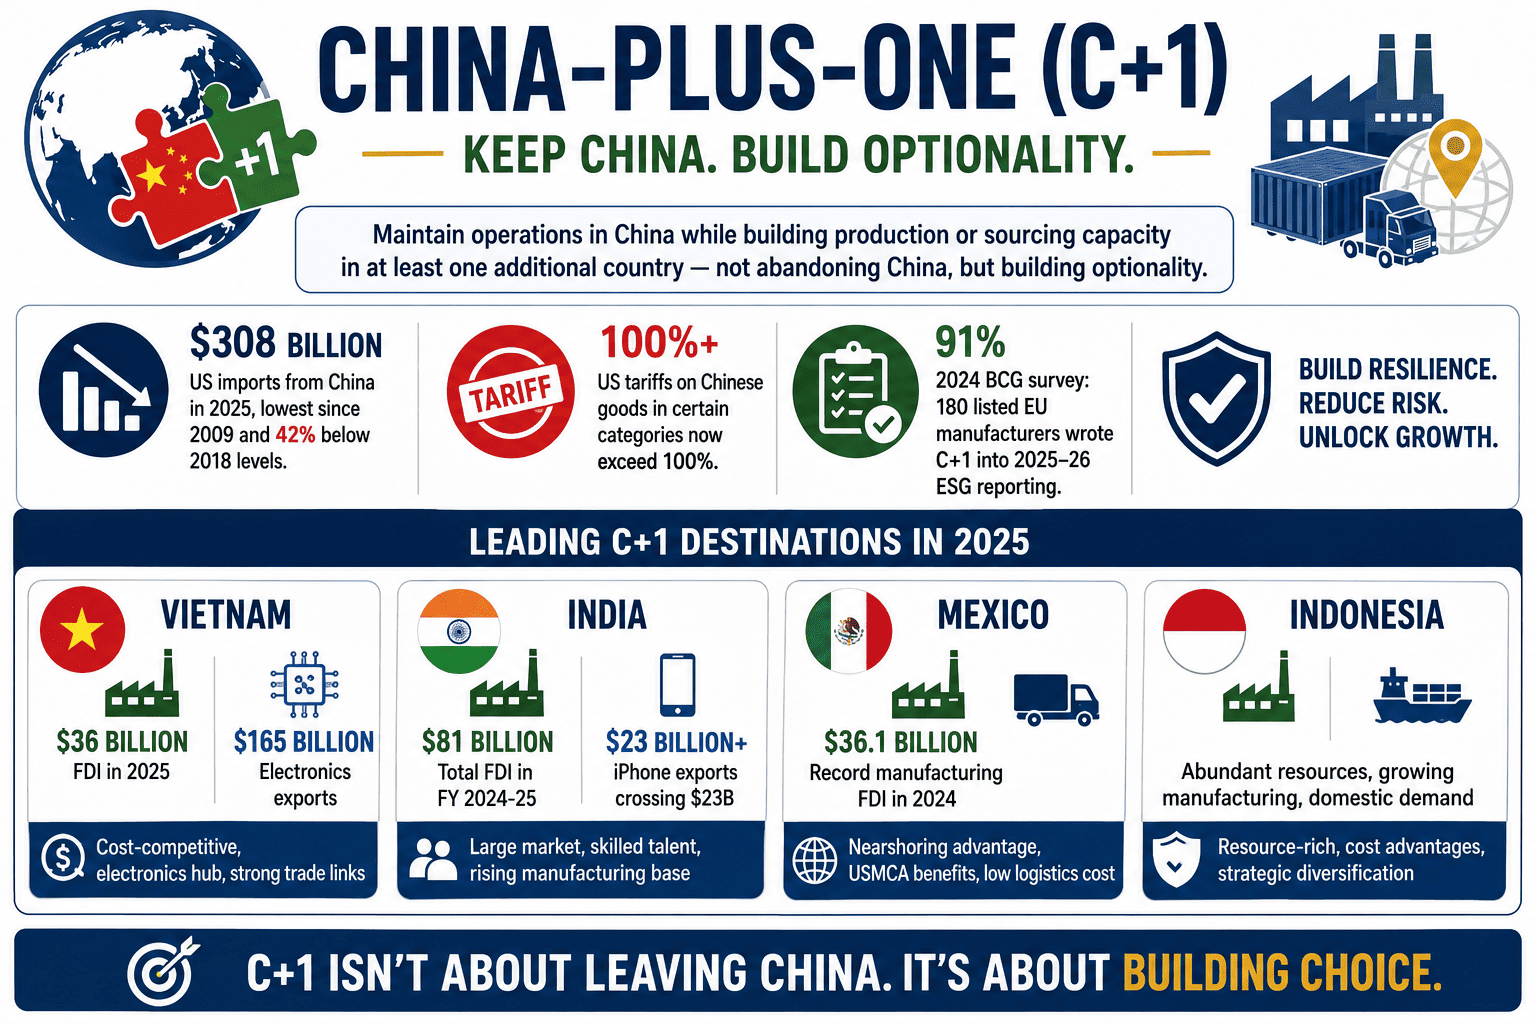
Direct Answer: The China-Plus-One (C+1) strategy is a supply chain approach in which companies maintain operations in China while simultaneously establishing production or sourcing capacity in at least one additional country, not abandoning China, but building optionality alongside it. US imports from China dropped to $308 billion in 2025, the lowest since 2009 and a 42% fall from 2018 figures. US tariffs on Chinese goods in certain categories now exceed 100%. A 2024 BCG survey found 91% of 180 listed EU manufacturers had written C+1 into their 2025–26 ESG reporting. The leading destinations are Vietnam ($36B FDI in 2025, $165B electronics exports), India ($81B total FDI in FY 2024-25, iPhone exports crossing $23B), Mexico ($36.1B record manufacturing FDI in 2024), and Indonesia, each serving a different cost, logistics, and risk profile.
📅 June 16, 2026⏱ 21 min read✍️ GT Setu Editorial Team🔄 Updated regularly
$308B
US Imports From China in 2025, Lowest Since 2009 (Commerce Dept.)
42%
Decline in US Imports From China vs. 2018 Peak
91%
of EU Manufacturers Have C+1 in ESG Reporting (BCG 2024)
0%
GTsetu Broker Commission on Verified Partner Discovery
For two decades, China was the undisputed factory of the world. No other country combined the depth of its component-supplier ecosystem, the scale of its manufacturing infrastructure, the efficiency of its logistics networks, and the competitiveness of its labour costs in a way that gave global buyers a compelling reason to look elsewhere. Then three compounding forces, rising labour costs, escalating US-China geopolitical tensions, and the COVID-19 supply chain disruptions of 2020–2022, turned the China-Plus-One strategy from an interesting theoretical proposition into an operational priority.
By 2026, C+1 is no longer a strategic option but a supply chain architecture expectation for any company serious about resilience. US tariffs on Chinese-origin goods in certain industrial and electronics categories now exceed 100%. US imports from China fell to $308 billion in 2025, the lowest level since 2009. China’s share of US imports fell 16 percentage points between 2022 and 2025, while Vietnam’s share rose 38% and Mexico’s rose 52%. And 91% of 180 listed EU manufacturers surveyed by BCG have written China-Plus-One into their 2025–26 ESG reporting. This guide covers the complete picture, what C+1 actually means, how it originated, where the leading destinations stand today, how to choose the right location for your specific product and supply chain, and how to find and verify manufacturing partners in alternative markets. For the practical frameworks governing the cross-border partnerships that every C+1 strategy ultimately requires, see our guides on cross-border business partnerships and contracts between manufacturer and distributor.
🏭 Who Is This Guide For?
This guide is written for procurement leaders, supply chain managers, founders, and business development executives evaluating or actively implementing a China-Plus-One diversification strategy, whether for electronics, automotive, textiles, pharmaceuticals, machinery, or another manufactured goods category. It draws on publicly available trade data, corporate disclosures, and industry research; it is not a substitute for market-specific commercial or legal advice. For the partner verification framework that every C+1 implementation eventually requires, see our guide on partnership evaluation criteria and our common red flags in international partnerships.
SECTION 1
1 What Is the China-Plus-One Strategy?
🎯 The Core Definition
The China-Plus-One strategy (C+1, China+1, or simply Plus One) is a supply chain and sourcing approach in which companies maintain their existing operations in China while simultaneously establishing production or sourcing capacity in at least one other country. The strategy does not require abandoning China, which still accounts for roughly 27–30% of global manufacturing output, or approximately US$4.85 trillion in 2025, but it does mean building meaningful optionality alongside that Chinese capacity, so that a disruption in China does not halt the entire supply chain.
The “plus one” framing is intentional: it signals that the strategy is about addition, not replacement. A company implementing C+1 might continue to source 80% of its components from established Chinese suppliers while building a second production source in Vietnam for the remaining 20%, enough to demonstrate diversification to customers and regulators, reduce tariff exposure on the affected portion, and activate a fallback if the Chinese source faces disruption. Over time, as the alternative source matures, that split often shifts further away from China, but the initial C+1 move is typically partial, not wholesale.
🛡️
Risk Mitigation, Primary Driver
A supply chain dependent on a single country is vulnerable to geopolitical disruption, natural disasters, pandemics, and trade policy volatility. C+1 creates optionality that allows companies to maintain production when one source is disrupted.
💰
Cost Management
Rising labour and production costs in China have been compounding since 2008, labour costs rose 37.9% in the decade to 2022. Plus One destinations like Vietnam and Bangladesh offer labour costs at roughly half of comparable Chinese factory roles.
📋
Regulatory & ESG Compliance
Legislation like the US Uyghur Forced Labour Prevention Act (UFLPA, 2022) creates compliance exposure for China-sourced goods. ESG reporting requirements increasingly require documented supply chain diversification with measurable KPIs attached.
🌍
Market Access
Establishing production in alternative countries provides access to new consumer markets, regional free trade agreements (ASEAN, CPTPP), and favourable bilateral trade relationships with key export destinations.
🔬
Technological Expertise
Certain regions are known for specialized capabilities, Vietnam for established electronics manufacturing, India for pharmaceuticals and software-enabled manufacturing, Mexico for automotive precision engineering. C+1 enables access to these specialized skill pools.
⚡
Supply Chain Resilience
The COVID-19 disruptions of 2020–2022, the 2021 Suez Canal blockage, and the 2024 Red Sea shipping attacks each demonstrated the catastrophic cost of single-source supply chains. C+1 is the structural response to those lessons.
SECTION 2
2 Origins and Evolution: From 2008 to 2026
The China-Plus-One concept did not emerge from a strategic think-tank paper, it emerged from operational necessity, first experienced by Japanese manufacturers before spreading globally.
🇯🇵
2008, Japanese Manufacturers Identify the Risk
The China-Plus-One concept most likely originated with Japanese businesses in the mid-to-late 2000s. Companies that had long relied on Chinese manufacturing were growing wary of supply chain risks, worsening Japan-China geopolitical tensions and rising manufacturing costs were the primary drivers. Some began looking to Vietnam, Thailand, and Malaysia as alternatives.
Origin Point
📈
2013–2015, Rising Chinese Labour Costs Go Global
The official China-Plus-One strategy was introduced as a named concept in 2013. Escalating Chinese labour costs, rising more than 37.9% over the following decade, led Western multinationals to begin seriously evaluating South and Southeast Asian alternatives. Vietnam and India emerged as the primary candidates discussed in Western business media.
Named Strategy
⚔️
2018–2020, US-China Trade War Adds Tariff Urgency
Section 301 tariffs on Chinese-origin goods, beginning at 25% on targeted categories in 2018, gave the C+1 strategy a concrete financial imperative beyond cost management. Companies with 100% China-sourced supply chains suddenly faced a per-unit cost disadvantage that made Plus One investments economically compelling regardless of other considerations.
Tariff Catalyst
😷
2020–2022, COVID-19 Makes Resilience Non-Optional
The pandemic-era factory shutdowns, port backlogs, and container shortages made the fragility of single-country supply chains viscerally real to every procurement team in the world. C+1 moved from a strategic option evaluated by progressive companies to an operational requirement demanded by customers, boards, and regulators across industries.
Resilience Imperative
🌐
2025–2026, 100%+ Tariffs and ESG Requirements Converge
US tariffs on certain Chinese-origin goods reaching 100%+, combined with ESG disclosure requirements that now mandate documented supply chain diversification metrics, have made C+1 a boardroom-level, compliance-driven programme rather than a procurement-team initiative. Vietnam’s FDI reached $36B in 2025; Mexico’s manufacturing FDI hit a record $36.1B in 2024; India’s manufacturing FDI grew 18% to $19B.
Current Stage
SECTION 3
3 Why C+1 Is More Urgent in 2026 Than It Has Ever Been
$308B
US imports from China in 2025, the lowest level since 2009 (US Dept. of Commerce, February 2026)
100%+
US tariffs on Chinese-origin goods in certain strategic industrial and electronics categories as of mid-2025
47%
of 180 surveyed EU manufacturers attach measurable KPIs to their C+1 diversification targets (BCG 2024 survey)
Three structural forces have converged to make 2026 the year China-Plus-One transitions from strategic planning to operational execution across the broadest range of industries yet.
Tariff exposure: US Section 301 tariffs on Chinese goods now range from 25% to over 100% on strategic categories including electronics, textiles, and EV components. The EU’s own tariff packages added further pressure in 2025. At 100%+ tariff rates, even significant labour and logistics cost advantages in China cannot offset the tariff burden for US-bound goods, making the landed-cost mathematics of diversification compelling for the first time across many product categories that were previously borderline.
Geopolitical risk: Diplomatic relations between the US and China remain tense. The Chinese government has demonstrated a willingness to throttle the supply of critical exports, including rare earth elements and critical minerals, in response to geopolitical pressure. Businesses that have experienced this first-hand have a very different risk calculus than those relying on modelled projections from 2019 trade data.
ESG and regulatory compliance: The UFLPA (2022) created direct compliance liability for goods with any nexus to forced labour in Chinese supply chains. ESG reporting frameworks increasingly require documented, KPI-backed supply chain diversification plans. What was once a voluntary corporate sustainability initiative has become a board-level governance requirement with legal and reputational consequences for non-compliance.
SECTION 4
4 The Advantages of the China-Plus-One Strategy
🔄
Supply Chain Resilience & Adaptability
Establishing suppliers in multiple countries creates a supply chain capable of withstanding localized disruptions. When one location faces a factory shutdown, port closure, or regulatory action, production can shift to the alternative source rather than halting entirely, the fundamental value proposition that COVID-19 proved empirically.
💱
Tariff Cost Reduction
Production in Vietnam, India, Mexico, or Indonesia avoids the 25–100%+ US tariff rates on Chinese-origin goods for categories subject to Section 301 measures. For many electronics, textile, and industrial goods, the tariff difference alone justifies the operational cost and complexity of establishing a Plus One source.
📋
ESG & Compliance Risk Reduction
Diversifying away from China reduces exposure to UFLPA forced-labour compliance risks, supports ESG reporting requirements that mandate supply chain diversification metrics, and reduces the risk of reputational damage from supply chain controversies, all of which have become material business risks, not peripheral concerns.
🌏
New Market Access
Plus One countries often provide access to their own domestic consumer markets, India’s $3.9 trillion economy and 1.4 billion consumers, Vietnam’s growing middle class, Mexico’s proximity to the US consumer market, as well as regional free trade agreements that open additional export channels.
👷
Labour Cost Competitiveness
Vietnam’s manufacturing labour costs run at roughly half of comparable Chinese factory roles. Bangladesh and Cambodia offer even lower labour costs for labour-intensive production. Mexico’s labour costs, while higher than Southeast Asia, are offset by eliminated shipping time and logistics costs for US-market distribution.
🔬
Access to Specialized Talent & Technology
Plus One destinations offer access to specialized capabilities unavailable at scale in China: India’s pharmaceutical R&D and IT-enabled manufacturing expertise, Vietnam’s growing electronics engineering talent, Mexico’s automotive precision manufacturing knowledge base built over decades of US OEM supply chain integration.
SECTION 5
5 The Challenges and Limitations of C+1
No strategic shift of this scale comes without meaningful operational challenges. Understanding the real costs and friction points of implementing C+1 is essential to planning a version of the strategy that is commercially sustainable rather than theoretically compelling.
Challenge
What It Actually Means
How to Manage It
Upfront transition costs
Finding new suppliers, qualifying them to your quality standards, tooling new factories, training new workforces, and managing split supply chains all require significant investment in time and capital before a single unit ships
Sequence the investment, start with high-tariff-exposure product lines first, where the ROI case is strongest, before extending to less-affected categories
Supplier ecosystem depth gap
China is the only country that possesses all industrial categories in the UN industrial classification. Alternative destinations rely on Chinese-sourced components for many sub-assemblies, meaning some C+1 implementations involve assembly in Vietnam of Chinese-origin components, which may not provide the origin-rule benefit expected
Conduct honest origin-rule analysis before assuming tariff benefits; a product must typically be “substantially transformed” in the Plus One country to qualify for preferential treatment
Quality control across multiple sites
Ensuring consistent product quality across two or more manufacturing locations requires meticulous monitoring, testing, and compliance effort, failure to invest in this produces quality inconsistencies that damage brand reputation
Invest in quality management infrastructure proportionally with each new production site; do not reduce quality oversight budget to fund the new location
Infrastructure and logistics gaps
China’s logistics infrastructure, high-speed rail, expressway networks, port capacity, is unmatched globally. Alternative destinations have varying infrastructure quality; logistics costs and transit times may be higher than assumed in initial business cases
Model total landed cost including logistics, not just factory gate price; conduct physical site assessment of transport and port access
Capacity constraints in established destinations
Vietnam’s industrial zone occupancy hit 85–95% in major provinces in 2025; skilled labour shortages are emerging in high-tech segments; industrial land costs have increased sharply. The most established Plus One destinations are running out of easy capacity
Consider second-tier Plus One destinations, Indonesia, Malaysia, Bangladesh, where capacity is more available even if ecosystem depth is shallower
Transshipment scrutiny
The US has imposed additional tariffs on goods deemed to be transshipped through Vietnam from China; moving final assembly to Vietnam while 90% of value is Chinese-origin components may not provide the tariff benefit anticipated and may attract enforcement scrutiny
Engage trade counsel to assess origin rules and transformation thresholds before designing the Plus One production model
💡 The Most Pragmatic First Move
For many complex manufactured goods, the most pragmatic near-term C+1 approach is keeping core production in China, where the component ecosystem, tooling capability, and engineering depth remain strongest, and moving only the labor-intensive final assembly (the last 20%) to an alternative location. This creates a partial tariff shield for markets where origin rules allow transformation-based claims, demonstrates supply chain diversification to customers and regulators, and builds operational capacity in the Plus One location before committing to deeper restructuring. See our guide on the true cost of global expansion for the full cost-modelling framework.
SECTION 6
6 The Leading Plus One Destinations in 2026
Three destinations dominate the 2026 C+1 conversation, each offering a radically different value proposition. A fourth and fifth tier, Indonesia, Malaysia, Thailand, Bangladesh, serve specific product and cost profiles. The right question is never “which country is best?” but “which country is best for this specific product, cost structure, compliance requirement, and supply chain objective?”
🇻🇳Most Established Alternative
Vietnam, The Default C+1 Destination
Vietnam is the first call for most businesses implementing China-Plus-One. Its proximity to Chinese supply chains (cross-border inbound freight within Southeast Asia is typically under three days) means components can cross from China with minimal disruption. The Hanoi–Ho Chi Minh City manufacturing corridor rivals Guangdong in density for certain electronics, plastics, and light manufacturing categories. Samsung, LG, Apple suppliers, Lululemon, and hundreds of other brands have established significant Vietnamese production capacity.
FDI 2025: $36B+ | Electronics exports 2023: $165B | Industrial zone occupancy: 85–95% in major provinces
🇮🇳Fastest Growing Alternative
India, Scale, Pharma & Smartphones
India is the only country with a labour force and market size comparable to China, and it is the only C+1 destination actively competing on both manufacturing and domestic market dimensions. India recorded FDI inflows of $81 billion in FY 2024-25 (a 14% year-on-year rise), with manufacturing FDI alone growing 18% to $19 billion. Apple’s iPhone exports from India crossed $23 billion in 2025, an 85% jump from 2024, and India’s share of global iPhone production reached approximately 25%.
Mexico wins decisively for US buyers. Road freight from manufacturing zones in northern Mexico (Monterrey, Juárez, Tijuana) to US distribution centres takes 4–8 days, compared to 25–35 days by sea from Vietnam or India. Foreign investment into Mexican manufacturing reached a record $36.1 billion in 2024. Dell, HP, and multiple automotive companies have established or expanded Mexican operations specifically for the US market. Mexico is a member of the USMCA free trade agreement with zero tariffs on qualifying goods into the US and Canada.
Manufacturing FDI 2024: $36.1B (record) | Road to US: 4–8 days | USMCA: zero tariffs to US/Canada
🇮🇩Highest Export Growth
Indonesia, Largest Southeast Asian Economy
Indonesia is the largest economy in Southeast Asia and the fourth most populous country globally, 285 million people in 2025. Exports grew from $180 billion in 2019 to $290 billion in 2023, at a 12.3% CAGR, the highest among Southeast Asian countries. Indonesia received $33 billion in greenfield manufacturing FDI in 2023, and the government’s nickel processing and EV battery supply chain initiatives are attracting significant battery-sector investment from Japanese, Korean, and Chinese manufacturers.
Export CAGR 2019-23: 12.3% (highest in SE Asia) | Greenfield MFG FDI 2023: $33B | Population: 285M
🇹🇭Automotive Hub
Thailand, Automotive & Regional Logistics
Thailand has established itself as Southeast Asia’s automotive manufacturing hub, producing approximately 2 million vehicles annually as a regional base for Toyota, Honda, Ford, and Isuzu. It serves as a regional logistics hub with well-developed infrastructure, deep-sea ports, and the established Eastern Economic Corridor (EEC) industrial zone, which offers 50-year land leases, corporate tax exemptions, and visa facilitation for qualifying investments.
Automotive output: 2M vehicles/year | EEC: 50-yr land leases + CIT exemptions | SE Asia logistics hub
🇧🇩Textiles & Apparel
Bangladesh, Lowest-Cost Textile Manufacturing
Bangladesh is the world’s second-largest garment exporter (after China), supplying H&M, Walmart, Gap, Primark, and hundreds of other global fashion brands. It offers among the lowest labour costs in the world for labour-intensive production, along with preferential market access (GSP/EBA duty-free access to the EU for qualifying goods). The Ready Made Garment (RMG) sector employs approximately 4 million workers and continues to expand capacity.
World’s 2nd largest garment exporter | EU duty-free access | RMG: 4M workers | Lowest C+1 labour cost
SECTION 7
7 Destination Comparison: Vietnam vs. India vs. Mexico vs. Indonesia
FactorVietnamIndiaMexico
Labour cost vs. China
~50% of China
30–50% of China
Higher than SE Asia but offset by logistics
Electronics manufacturing depth
Very deep, Samsung, Apple suppliers, LG
Growing rapidly, Apple 25% share
Dell, HP, some electronics
US market logistics
25–35 days sea freight
25–35 days sea freight
4–8 days road freight (USMCA)
EU market logistics
18–22 days sea
16–20 days sea
18–25 days Atlantic, less optimal
FTA / trade agreement access
CPTPP, ASEAN, EVFTA (EU)
Bilateral agreements; no major US FTA
USMCA, zero tariffs US/Canada
Available industrial capacity
85–95% zone occupancy, tight
PLI schemes, expanding actively
Northern Mexico tightening; south available
Pharma / specialty chemicals
Limited depth
World-leading, $30B exports FY24-25
Growing; proximity to FDA regulation
Domestic market potential
95M, growing middle class
1.4B, fastest-growing large economy
130M, close to US consumer market
Transshipment scrutiny risk
US additional 40% tariff on transshipped goods
Lower scrutiny, more independent supply chain
USMCA rules-of-origin well-established
SECTION 8
8 Sector-by-Sector C+1 Adoption Patterns
China-Plus-One adoption patterns differ materially by sector, driven by the specific combination of tariff exposure, labour intensity, supply chain complexity, and upstream component dependencies that characterise each industry.
Sector
Leading Plus One Destinations
Primary Driver
Key Constraint
Notable Examples
Electronics & Smartphones
Vietnam, India
Tariff exposure + geopolitical risk
Chinese-origin component dependency for sub-assemblies; transshipment rules
Apple (India iPhone 25% share, $23B exports); Samsung (Vietnam); Dell, HP (India/Vietnam)
Textiles & Apparel
Bangladesh, India, Vietnam, Cambodia
Rising Chinese labour costs
Bangladesh infrastructure and compliance capacity
H&M, Walmart, Gap, Primark, significant Bangladesh and Vietnam sourcing
Automotive & EV
Mexico, India, Thailand
US market proximity (Mexico); EV battery supply chain diversification
Highly integrated supply chains; quality and precision requirements
Tesla (Mexico), Ford (Mexico expansion), Foxconn ($1.5B India investment)
Pharmaceuticals
India
US/EU regulatory independence from Chinese API supply
FDA/EMA approval timelines for facility qualification
India pharma exports: $30B+ in FY 2024-25 (9%+ growth); US = largest market
Semiconductors
US, Japan, Germany (reshoring); Malaysia, India (midshore)
National security; CHIPS Act incentives
Capital intensity; talent concentration still in Taiwan and South Korea
Precision engineering capability outside China still developing
Growing industrial zone investment in India PLI scheme; Mexico automotive supply chain
Solar / Renewable Energy
India, Malaysia, Vietnam
US IRA (Inflation Reduction Act) incentives; Section 301 tariffs on Chinese solar panels
Chinese-origin polysilicon and wafer dependency up the supply chain
India positioning as solar PV alternative; US AD/CVD duties on Chinese solar
💡 The Apple Case Study, C+1 at Scale
Apple’s supply chain diversification is the most closely watched C+1 implementation in the world. Apple produces around 90% of its devices in China, but is actively reducing that dependency. JPMorgan analysis projected China-based production to fall from 95% to approximately 75% by 2025. As part of this strategy, Apple relocated iPhone assembly to India through Foxconn, Pegatron, and Wistron/Tata Electronics, reaching 25% of global iPhone production by 2025, with Indian iPhone exports crossing $23 billion (an 85% year-on-year jump). Apple also expanded Mac and iPad assembly in Vietnam. The Apple case demonstrates both the scale of what C+1 can accomplish and the realistic timeline: this transition has been active since 2019 and continues to develop years later.
SECTION 9
9 How to Choose Your Plus One Location: A Five-Factor Framework
Choosing the right Plus One location is the most consequential operational decision in any C+1 implementation. The right answer varies by product, cost structure, compliance requirement, and supply chain objective, which is why the best starting question is not “which country is best?” but “which country is best for this specific product in our specific situation?”
💰
Factor 1: Total Cost Structure
The headline factory-gate price comparison is rarely the right number. Total landed cost must include: regulatory compliance costs in the new location; logistics and transit time costs; tooling investment required; quality control infrastructure; and split-shipment premiums when order volumes at new suppliers fall below full-container minimums.
🌐
Factor 2: Geopolitical & Tariff Risk
Assess not just current tariff rates but trajectory and bilateral relationship stability. The April 2025 US “reciprocal tariff” announcements initially imposed 46% on Vietnam, 36% on Thailand, 32% on Indonesia, then reduced after negotiations. Rapid changes highlight how unpredictable trade policy can be for any single alternative destination.
🚢
Factor 3: Infrastructure & Logistics
China’s infrastructure advantage is the hardest to replicate, it has the largest networks of high-speed rail and expressways globally, with ports sized to handle its manufacturing volume. Evaluate alternative destinations’ transport networks, port access, and proximity to key markets carefully; logistics costs can completely undermine an apparently attractive factory-gate price advantage.
🔗
Factor 4: Supplier Ecosystem Depth
How deep is the local component supply chain? A destination that requires 80% of materials and sub-assemblies to be imported from China, the situation for many SE Asian electronics manufacturers, may not provide the genuine diversification benefit assumed. Assess upstream component availability, local material sourcing, and engineering support depth alongside the final assembly capability.
👷
Factor 5: Workforce Quality & Availability
Evaluate technical skill level, educational infrastructure, language capability, labour market size, workforce stability (turnover rates in Ho Chi Minh City industrial zones are high), and government training programmes. A location with cheap but rapidly churning labour creates quality consistency problems that undermine the cost advantage.
📜
Origin Rules, The Often-Missed Factor
Does moving production to the Plus One country actually deliver the expected tariff benefit? US origin-rule enforcement requires “substantial transformation”, products assembled in Vietnam from Chinese components may be subject to additional scrutiny and the 40% transshipment tariff. Engage trade counsel to verify origin rules before designing the Plus One production model.
SECTION 10
10 Implementing C+1: The Step-by-Step Framework
01
Quantify Your Current China Exposure
Map your supply chain by country of origin at the component level, not just the finished-goods level. Identify which products and components carry the highest tariff exposure, which face the greatest supply disruption risk, and which are most vulnerable to ESG or compliance scrutiny. This exposure map determines the priority sequence for C+1 implementation.
02
Run Total Landed Cost Analysis for Each Candidate Destination
For the top-priority products, model total landed cost, not factory gate price, for each candidate Plus One destination, including logistics, compliance, quality control infrastructure, tooling, and split-order premium costs. This typically narrows the short list of viable destinations from five or six to two or three for any specific product category.
03
Verify Origin Rules Before Assuming Tariff Benefits
Engage a trade attorney or customs broker to confirm whether production at your chosen Plus One destination actually qualifies for preferential tariff treatment under applicable US, EU, or other market origin rules. The substantial transformation test, rules of origin under FTAs (USMCA, CPTPP, EVFTA), and transshipment provisions all require specific legal analysis for specific products.
04
Identify and Verify Candidate Manufacturers or Partners
Use a verified partner discovery platform to identify candidate manufacturers in the target destination, verify their business registration, financial standing, production capacity, and technical capability before visiting or engaging. Physical site visits for shortlisted candidates validate capacity claims that no document review can confirm. See Section 11 for the partner verification framework.
05
Execute a Pilot Production Run Before Full Commitment
Before committing full production volumes to any new Plus One supplier, run a qualification pilot, typically 1–3 shipments at a defined volume, to validate quality, lead times, packaging, and logistics performance against agreed specifications. Pilot failures caught before full-volume commitment are expensive; quality failures discovered at retail are catastrophic.
06
Formalise the Partnership With Appropriate Contracts
Execute manufacturing or distribution agreements that address IP ownership (particularly for tooling and moulds, see our guide on who owns tooling and moulds), quality standards and audit rights, exclusivity and volume commitments, payment terms, force majeure provisions, and dispute resolution. Do not skip the contract step because a relationship feels collaborative, it is the contract that governs what happens when something goes wrong.
07
Monitor, Measure, and Expand Progressively
Track Plus One performance against defined KPIs, quality yield, lead time, cost per unit, tariff savings, supply chain resilience metrics, on a quarterly basis. Expand volume and scope progressively as the new partner demonstrates consistency, rather than committing full volumes before reliability is proven. Build a multi-supplier architecture over time rather than recreating a single-source dependency in the Plus One country.
SECTION 11
11 Finding and Verifying Partners in Plus One Markets
Every C+1 implementation eventually comes down to the same practical question: who, specifically, is going to manufacture or distribute the product in the alternative country? The quality of that partner determines whether the strategy succeeds operationally. A manufacturer who overstates capacity, misrepresents quality capability, or lacks genuine engineering support will undermine the entire C+1 business case regardless of how sound the country selection and cost model are.
The partner verification challenges in C+1 destinations are similar to those in any international partner search, but compounded by the fact that manufacturing capability is inherently harder to verify remotely than commercial credentials. A company can have legitimate business registration, accurate financial references, and credible customer testimonials while still lacking the specific tooling capability, engineering depth, or quality management infrastructure required for your product. This is why physical site verification, for manufacturing partners specifically, is a standard element of serious C+1 due diligence, not an optional upgrade.
The single most common C+1 partner mistake is selecting a manufacturer based on claimed production capacity and headline price without independently verifying either. A factory claiming 50,000 units per month capacity whose facility clearly cannot support that throughput on any reasonable physical assessment is misrepresenting the single most commercially important fact in a manufacturing partnership. Physical site visits, either directly or through a third-party inspection service, should be standard in any C+1 implementation that moves beyond initial supplier assessment. The cost of a site visit is trivial compared to the cost of discovering a capacity or quality misrepresentation six months into production.
SECTION 12
12 How GTsetu Supports China-Plus-One Strategy Execution
🏭 GTsetu, Verified Manufacturing Partner Discovery for C+1 Implementation
Find Pre-Verified Manufacturers in Plus One Markets, Without Starting From Zero
The hardest part of any C+1 implementation is not choosing the destination country, it is finding and qualifying a specific manufacturer in that country whose capacity, quality standards, and reliability can actually support your production requirements. GTsetu pre-verifies every company in its network through business registration, tax ID, import/export licences, industry certifications, and authority letter confirmation before they appear. You discover and evaluate candidate manufacturers anonymously, execute an NDA before sharing product specifications or pricing, and engage through an encrypted workspace, with zero broker commissions on any partnership formed. GTsetu’s B2B matchmaking tool and international business development consulting resources complement the discovery process for C+1 market-entry analysis.
🏛️
Pre-Verified Business Identity
Every manufacturer on GTsetu has been checked against business registration, tax ID, and licensing records, eliminating fabricated company profiles that are common in open manufacturing directories.
🕵️
Anonymous Discovery
Evaluate candidate manufacturers in Vietnam, India, Mexico, and other C+1 destinations without revealing your strategic plans or product specifications until you choose to engage.
📄
NDA Before Product Specifications
A digital mutual NDA with timestamped signatures is in place before product designs, quality specifications, or pricing are shared, protecting IP during the most sensitive phase of C+1 supplier qualification.
🔐
Encrypted Document Workspace
Share technical specifications, quality standards, and preliminary commercial terms through an AES-256 encrypted workspace with full access controls and audit trail.
🚫
Zero Broker Commission
GTsetu charges no commission on any manufacturing partnership formed, the commercial terms of your C+1 supply arrangement stay strictly between you and your manufacturer.
🌏
Leading C+1 Markets Covered
GTsetu’s verified network spans Vietnam, India, Mexico, Indonesia, Thailand, Bangladesh, and other leading Plus One destinations, supporting whichever combination of countries your C+1 architecture requires.
The China-Plus-One strategy (also written C+1 or China+1) is a supply chain approach in which companies maintain their existing manufacturing or sourcing operations in China while simultaneously establishing production capacity in at least one additional country. The goal is to reduce risks associated with over-dependence on China, geopolitical tensions, rising labour costs, tariff exposure, regulatory compliance risk, and supply chain disruption, without abandoning China’s unmatched component ecosystem, manufacturing scale, and infrastructure advantages. China still accounts for roughly 27–30% of global manufacturing output ($4.85 trillion in 2025), and no single alternative destination has replicated that depth. C+1 is therefore about building optionality alongside China, not replacing it, though for some product categories and some companies, the strategy has evolved toward “Anywhere But China” as tariff rates on Chinese-origin goods have reached 100%+ in certain US categories.
QWhich countries benefit most from the China-Plus-One strategy?
The primary beneficiaries of the China-Plus-One strategy in 2026 are: Vietnam, the most established alternative, attracting over $36 billion in FDI in 2025 with electronics exports reaching $165 billion in 2023, though industrial zone occupancy in major provinces has hit 85–95%; India, recording FDI inflows of $81 billion in FY 2024-25 (a 14% rise year-on-year) with manufacturing FDI growing 18%, and Apple’s iPhone exports crossing $23 billion (an 85% year-on-year jump) with India reaching approximately 25% of global iPhone production; Mexico, attracting a record $36.1 billion in manufacturing FDI in 2024, with a decisive logistics advantage for US buyers (road freight of 4–8 days versus 25–35 days by sea from Southeast Asia) and USMCA zero-tariff access to the US and Canada; and Indonesia, the largest Southeast Asian economy with the highest CAGR of export growth among the region’s countries (12.3% from 2019 to 2023). In the broader tier, Bangladesh leads in textiles and apparel; Thailand leads in automotive; Malaysia in established electronics; and Mexico increasingly in complex precision manufacturing.
QIs the China-Plus-One strategy still relevant in 2026?
More relevant than at any point since the strategy was named in 2013. US imports from China dropped to $308 billion in 2025, the lowest level since 2009 and a 42% decrease from the 2018 peak, according to US Department of Commerce data. US tariffs on Chinese-origin goods in certain industrial and electronics categories now exceed 100%, making Chinese-manufactured products uncompetitive at any freight differential for some US-bound categories. A 2024 BCG survey of 180 listed EU manufacturers found that 91% had written China Plus One into their 2025–26 ESG reporting, with 47% attaching measurable KPIs to the diversification target. China’s share of US imports fell 16 percentage points between 2022 and 2025, while Vietnam’s share rose 38% and Mexico’s rose 52%. For US companies specifically, the strategy has evolved beyond C+1 toward “anywhere but China” for some categories, with HP Inc. planning to have 90% of North American products manufactured outside China by end-2025.
QHow do I choose the right Plus One location for my business?
Choosing the right Plus One location requires a five-factor analysis applied to your specific product: (1) Total cost structure, not factory gate price but total landed cost including logistics, compliance, tooling, quality control infrastructure, and split-shipment premiums for smaller volumes at new suppliers. (2) Geopolitical and tariff risk, not just current tariff rates but trajectory and bilateral relationship stability; the April 2025 US “reciprocal tariffs” initially imposed 46% on Vietnam before being reduced, illustrating how rapidly the landscape can change. (3) Infrastructure and logistics, transport networks, port access, and transit time to your key markets; Mexico’s 4–8 day road freight to the US versus 25–35 days by sea from Southeast Asia is a decisive factor for US market supply. (4) Supplier ecosystem depth, how deep is the local component supply chain; a destination requiring 80% of materials to be imported from China may not provide the genuine diversification or tariff benefit assumed. (5) Workforce quality and availability, technical skill level, labour market size, and workforce stability. The right question is never “which country is best?” but “which country is best for this specific product, cost structure, compliance requirement, and supply chain objective?”
QWhat are the main challenges of implementing a China-Plus-One strategy?
The main challenges of implementing a C+1 strategy are: (1) Upfront transition costs, finding, qualifying, and tooling new suppliers requires significant investment in time and capital before a unit ships; (2) Supplier ecosystem depth gaps, alternative destinations lack the vertically integrated component ecosystem that makes China so efficient, meaning many “Plus One” implementations still depend on Chinese-origin sub-assemblies, which can complicate tariff origin-rule claims; (3) Quality control across multiple sites, consistent product quality across two or more manufacturing locations requires proportionally scaled quality management investment; (4) Infrastructure gaps, alternative destinations rarely match China’s logistics infrastructure depth; (5) Capacity constraints, Vietnam’s major industrial zones are at 85–95% occupancy; established C+1 destinations are running out of easy capacity; (6) Transshipment scrutiny, the US has imposed additional 40% tariffs on goods deemed to be transshipped through Vietnam from China, meaning assembly of Chinese-origin components in Vietnam may not deliver the expected tariff benefit. Despite these challenges, the companies that have invested in C+1 implementation, Apple, Dell, HP, Samsung, consistently report improved supply chain resilience and reduced tariff exposure that justifies the transition cost.
Discover pre-verified manufacturers in Vietnam, India, Mexico, Indonesia, and other leading C+1 destinations through GTsetu, anonymous discovery, built-in NDA, encrypted workspace, and zero broker commissions.
They represents the product, and research team behind GTsetu, a global B2B collaboration platform built to help companies explore cross-border partnerships with clarity and trust. The team focuses on simplifying early-stage international business discovery by combining structured company profiles, verification-led access, and controlled collaboration workflows.
With a strong emphasis on trust, and disciplined engagement, Team GTsetu shares insights on global trade, partnerships, and cross-border collaboration, helping businesses make informed decisions before entering deeper commercial discussions.