How to Estimate the Market Size for Your Products Overseas
A market size figure is only useful if it reflects what you can actually sell, not the headline number from an industry report. Estimating overseas demand well means moving through three layers: the total demand for your product category, the portion of that demand you can reach given your price, certifications, and distribution, and the share you can realistically win against local and international competitors. This guide walks through each layer, the top-down and bottom-up methods that produce them, the data sources that work for cross-border sizing, the adjustments that turn raw demand into an honest sales forecast, and how to test your estimate with real partners before you commit capital.
📅 Published September 14, 2026⏱ 13 min read✍️ GTsetu Editorial🔄 Updated September 14, 2026
Almost every overseas expansion plan starts with a market size slide. Far fewer of those slides survive contact with reality, because the number on them was often a global industry total, divided by a guess, and presented as a forecast. The companies that expand successfully tend to be the ones that treated market sizing as a piece of real analysis rather than a formality, using it to decide which country to enter first, how much inventory to commit, and which partner relationships to prioritise. That discipline sits at the heart of effective global market research for manufacturers.
Section 1
Why Market Sizing Matters Before You Go Overseas
Entering a foreign market is expensive: certifications, sample shipments, local partner time, marketing, and working capital all arrive before the first meaningful order does. A credible market size estimate does three jobs at once. It tells you whether the opportunity is large enough to justify that upfront cost, it helps you rank candidate countries against each other, and it gives investors, lenders, and internal decision-makers a defensible basis for approving the plan.
📌 A good estimate is a range, not a point
No overseas market size figure is exact. The goal is a defensible range built on stated assumptions, with a clear sense of which assumptions the answer is most sensitive to. A range of “USD 8 to 14 million, most sensitive to the distributor margin” is far more useful than a falsely precise “USD 11.3 million.”
Section 2
TAM, SAM, and SOM: The Three Numbers You Need
The Funnel
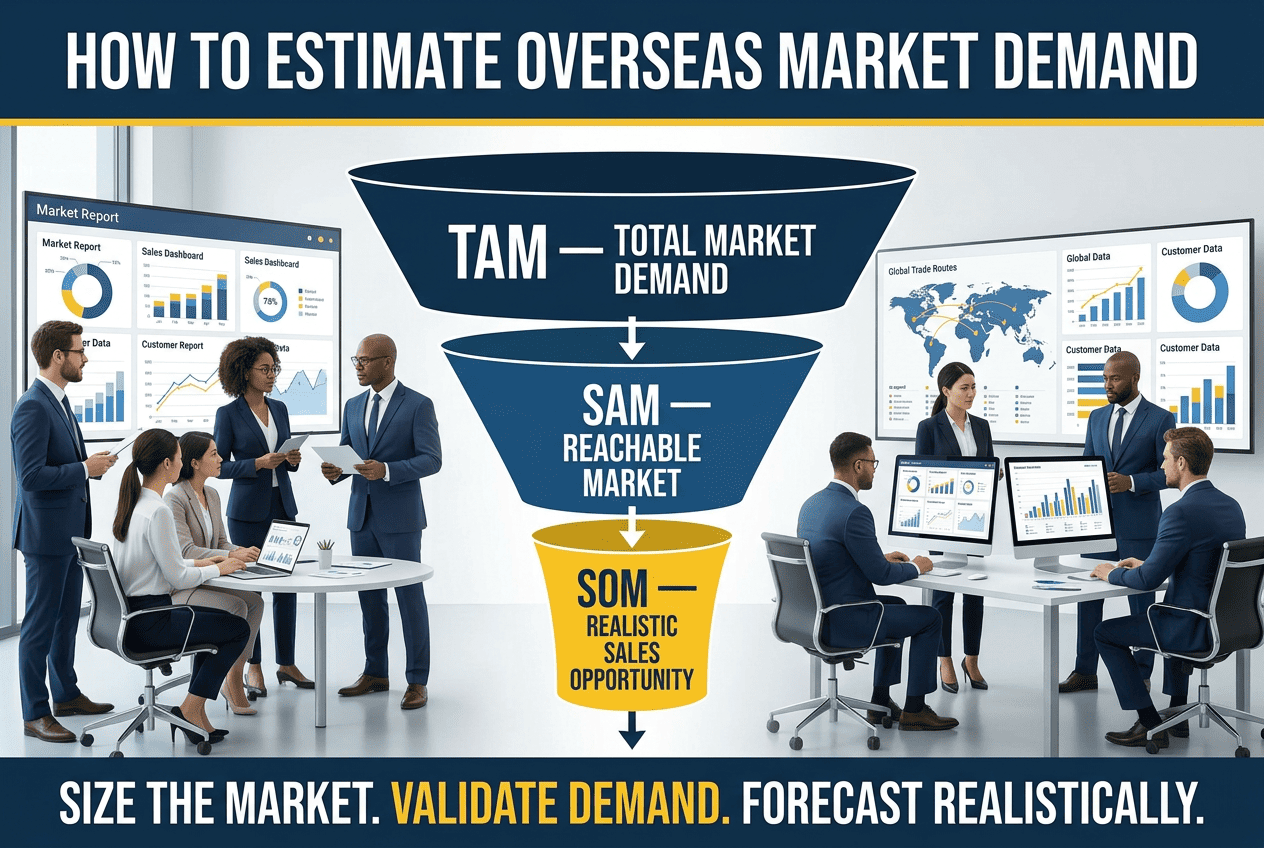
Market sizing is easiest to understand as a funnel that narrows from everything that could theoretically be sold down to what you can realistically capture. Each layer answers a different question and each is used for a different decision.
1
TAM: Total Addressable Market
All demand for your product category in the target country
Widest View
TAM is the full annual value, or volume, of demand for your product category in the target market if every possible buyer purchased from every possible supplier. It is useful for judging whether a country is worth looking at at all, and for comparing countries on a like-for-like basis, but it is almost never the number your business plan should be built on.
🎯
Use it for: Country shortlisting and early screening. A market with a small TAM rarely rescues a weak plan, however good your execution.
2
SAM: Serviceable Available Market
The part of TAM your product, price, and channels can actually reach
Decision-Relevant
SAM narrows TAM to the segments you can genuinely serve: the customer types you target, the regions your distribution covers, the price tier your product sits in, and the regulatory and certification requirements you can meet. For overseas expansion, this is where most of the real analysis happens, because the gap between TAM and SAM is usually where tariffs, standards, and channel access do their work.
🎯
Use it for: Choosing which segments and regions to enter first, and for setting realistic distributor targets.
3
SOM: Serviceable Obtainable Market
The share of SAM you can realistically win in a defined period
Forecast Basis
SOM is the slice of SAM you can capture given competitor strength, your production capacity, your partner network, and how long it takes to build brand recognition. It is the number that should actually drive your sales forecast, inventory plan, and breakeven analysis, and it is almost always a single-digit percentage of SAM in the first few years.
🎯
Use it for: Revenue forecasting, capacity planning, and any financial model you show a lender or investor.
💡 A worked example (illustrative figures only)
Suppose a manufacturer of industrial valves finds a country’s total valve imports and domestic output add up to USD 400 million (TAM). After filtering to the pressure ratings and industries its product serves, and to the regions its distributor covers, the serviceable portion is USD 90 million (SAM). Against entrenched competitors, and with limited capacity, a realistic three-year share of 4 percent gives a SOM of roughly USD 3.6 million a year. The plan should be built on the USD 3.6 million, not the USD 400 million.
Section 3
Top-Down vs. Bottom-Up: Choosing Your Method
There are two standard routes to a market size estimate, and strong analysis uses both, because each catches the other’s blind spots.
Approach
How It Works
Strengths
Weaknesses
Top-down
Start from a large published figure (industry revenue, import volume, GDP segment) and narrow it with percentages for your segment and region
Fast, cheap, good as an initial sanity check
Depends on third-party definitions that may not match your product, and can be inflated by loose category boundaries
Bottom-up
Count the realistic number of buyers, multiply by expected purchase volume and your actual price
Grounded in real customers and prices, easier to defend and to stress-test
More time-consuming, and requires reliable data on buyer counts and purchasing behaviour
Value theory
Estimate what customers would pay for the value your product creates, then multiply by the number of potential buyers
Useful for new or differentiated products with no clear comparable category
Heavily assumption-driven, so it needs validation through buyer conversations
When the top-down and bottom-up figures land within a reasonable range of each other, confidence in the estimate rises. When they diverge widely, the gap is usually pointing at a flawed assumption, such as a category defined too broadly in the top-down figure, or a buyer count in the bottom-up figure that ignores how many buyers are locked into existing supply contracts. Resolving that gap is often the most valuable part of the exercise.
Section 4
Data Sources That Work for Cross-Border Sizing
Overseas sizing is harder than domestic sizing mainly because data is less consistent across countries. A handful of source types do most of the work.
🚢
Customs and trade statistics
Import and export data by HS code, from national customs agencies and international trade databases, shows actual volumes, values, and the countries currently supplying your category.
Best for import-led markets
🏛️
Government and statistical agencies
National statistics offices and industry ministries publish production, consumption, and company-count data that anchor bottom-up buyer estimates.
Best for buyer counts
📑
Industry reports and trade associations
Paid and free sector reports provide top-down category sizes and growth rates, though definitions vary and should always be checked.
Best for top-down checks
🏢
Competitor and listed-company disclosures
Annual reports and filings from competitors active in the market reveal revenues, pricing signals, and channel structure.
Best for share estimates
🤝
Distributor and buyer conversations
Direct conversations with international wholesale distributors and prospective buyers give the demand, pricing, and margin detail that no report contains.
Whenever possible, define your product by its Harmonized System (HS) code and size the market from import and production data for that code. It removes most of the ambiguity about what “the market” includes and makes your estimate directly comparable across countries, which matters when you are choosing where to enter first. The same discipline applies to emerging categories too, where clear product definitions are scarce, as in the early-stage ecosystems covered in our look at Maharashtra’s FTI and the future of quantum technology in Pune.
Section 5
Adjustments That Turn Demand Into a Realistic Estimate
Raw demand figures overstate what a foreign supplier can sell. A set of adjustments, applied in order, converts the headline number into something you can plan around.
1
Remove demand you cannot legally or practically serve
Add freight, insurance, duties, taxes, and local handling to your ex-works price to see where you actually sit against local competitors. Your chosen trade term decides who pays for what, so be precise about Incoterms 2020, including terms such as FCA (Free Carrier), when building the price comparison.
3
Account for the distribution margin
Distributors and retailers take margin at each layer. Your revenue per unit is the end-customer price minus those margins, minus landed-cost items, so a market that looks large at shelf price can be much smaller at the point where you actually invoice.
4
Apply a realistic competitive share
Map incumbent suppliers, their pricing, and their channel relationships. A newcomer with no local reputation rarely wins double-digit share early, so build the ramp-up curve into SOM rather than assuming mature-state share from year one.
5
Cap the estimate by your own capacity and supply chain
Vary price, distributor margin, tariff rates, and share by plausible amounts to see which inputs move the answer most. Those are the assumptions to verify first.
Section 6
Validating Your Estimate Before You Commit
A spreadsheet estimate is a hypothesis. Before you rely on it, test it against the people who actually buy and sell your category in the target market, and against a structured review of the commercial case. A formal commercial due diligence exercise, covering market demand, competitive position, and customer concentration, is the standard way to stress-test the assumptions behind the number before capital is committed.
The validation step is also where market sizing connects to contract design. Once a distributor tells you what volume the market can bear, those expectations tend to become minimum purchase commitments and performance targets in an agreement, and it is worth understanding the terms that govern what happens when they are missed. A Master Services Agreement (MSA) or distribution agreement should define what counts as a material breach, the remedies available for a breach of contract, how far consequential damages are limited, what a warranty clause promises about product quality, and whether either side can exit through termination for convenience if the market turns out smaller than expected. Allocating these exposures deliberately, rather than discovering them in a dispute, is the subject of our guide to risk allocation in cross-border deals.
Some companies skip the slow build-up entirely and buy their way into a market by acquiring a local business. In that case, the market size estimate feeds directly into valuation, and understanding what an asset purchase agreement covers helps you structure the deal around the assets and customer relationships that actually underpin the revenue you are modelling.
🤝 For Verified Long-Term Partnerships Overseas
GTsetu: Turn Your Market Size Estimate Into Real Partner Conversations
The most reliable way to validate an overseas market size is to talk to credible local distributors, manufacturers, and buyers, and the hardest part of that is finding counterparts you can trust enough to share real numbers with. GTsetu is built for that step. It is a structured partnership platform, not a directory or a general marketplace, where every company is verified on 6 government-sourced points before engagement, where discovery is anonymous until mutual interest is confirmed, where NDAs are executed digitally before any commercial information changes hands, and where document exchange happens through an encrypted workspace with a full audit trail.
GTsetu is used by manufacturers, distributors, and raw material suppliers across 100+ countries to find verified partners, test demand with them under NDA, and formalise cross-border business partnerships once the numbers hold up, applying consistent partnership evaluation criteria across every market you compare.
🏛️
6-Point Government-Sourced Verification
Name, Address, Registration Number, Company Status, Company Type, and Date of Incorporation, verified using government tie-ups before any engagement.
🕵️
Anonymous Discovery
Browse verified partner profiles across 100+ countries without revealing your own identity or market entry strategy until you choose to engage.
📄
Built-In NDA Workflow
Digital NDA with timestamped signatures before any pricing, volumes, or product specs are shared.
🔐
Encrypted Document Workspace
All commercial documents shared through encrypted channels with a full access audit trail, not email attachments.
🌍
100+ Countries
Verified manufacturers and distributors across Asia, the Middle East, Europe, Africa, Australia, and the Americas.
🚫
Zero Commission
No success fee, no broker commission, ever. Your partnership economics remain entirely between you and your partner.
Market sizing is not a one-off exercise. Treat the first estimate as version one, refine it with every partner conversation, and re-run it when a tariff changes, a competitor exits, or a new certification opens a segment. For a worked picture of how country-specific analysis turns into an entry plan, see our guide to expanding a manufacturing and industrial automation business into the Czech Republic.
FAQ
Frequently Asked Questions
QHow do you estimate the market size for a product in another country?
Start by defining the product category precisely, ideally with its customs classification (HS code), then estimate total demand using both a top-down method, which starts from published industry or trade figures, and a bottom-up method, which builds up from the number of potential buyers multiplied by realistic purchase volume and price. Narrow the total to the share you can actually serve given tariffs, certifications, distribution reach, and competition, then validate the result with in-market partners before relying on it.
QWhat is the difference between TAM, SAM, and SOM?
TAM, the total addressable market, is the full demand for a product category in a market. SAM, the serviceable available market, is the portion of that demand your business can actually reach given your product, pricing, certifications, and distribution channels. SOM, the serviceable obtainable market, is the share of SAM you can realistically capture in a given period given competition and your capacity. For overseas expansion, SAM and SOM are usually far more decision-relevant than TAM.
QShould I use a top-down or bottom-up approach to market sizing?
Use both. Top-down estimates are fast and useful for a first sanity check but depend on third-party figures that may not match your exact product definition. Bottom-up estimates take longer but are grounded in actual buyers, prices, and volumes, which makes them more reliable for planning. When the two land within a reasonable range of each other, confidence in the estimate rises; when they diverge widely, the gap usually points to a flawed assumption worth investigating.
QHow do I check whether my market size estimate is realistic?
Test it against real people and real data: speak with prospective distributors and buyers in the target market, compare your assumptions with customs import data for your product category, and review how competitors are priced and positioned. A structured commercial due diligence process, with sensitivity testing on your key assumptions, helps show how much the estimate changes if a few inputs prove wrong.
QHow often should I update an overseas market size estimate?
Treat it as a living document. Refresh it at least annually, and whenever a material input changes, such as a tariff or regulatory change, a new competitor entering or leaving, a shift in exchange rates, or new information from a distributor or buyer. Early in an expansion, updating after each round of partner conversations is worthwhile, since each one typically corrects at least one assumption.
Ready to Test Your Market Estimate With Verified Partners?
GTsetu is purpose-built for manufacturers, distributors, and raw material suppliers in industrial sectors seeking verified long-term trade partnerships, across 100+ countries, with government-sourced partner verification, built-in NDA workflows, and zero commission.
They represents the product, and research team behind GTsetu, a global B2B collaboration platform built to help companies explore cross-border partnerships with clarity and trust. The team focuses on simplifying early-stage international business discovery by combining structured company profiles, verification-led access, and controlled collaboration workflows.
With a strong emphasis on trust, and disciplined engagement, Team GTsetu shares insights on global trade, partnerships, and cross-border collaboration, helping businesses make informed decisions before entering deeper commercial discussions.